Let’s continue
A brief outlook of how the confluence, consolidation and continuation of a range-bound market could trigger altcoin breakouts to the 200-day moving average.
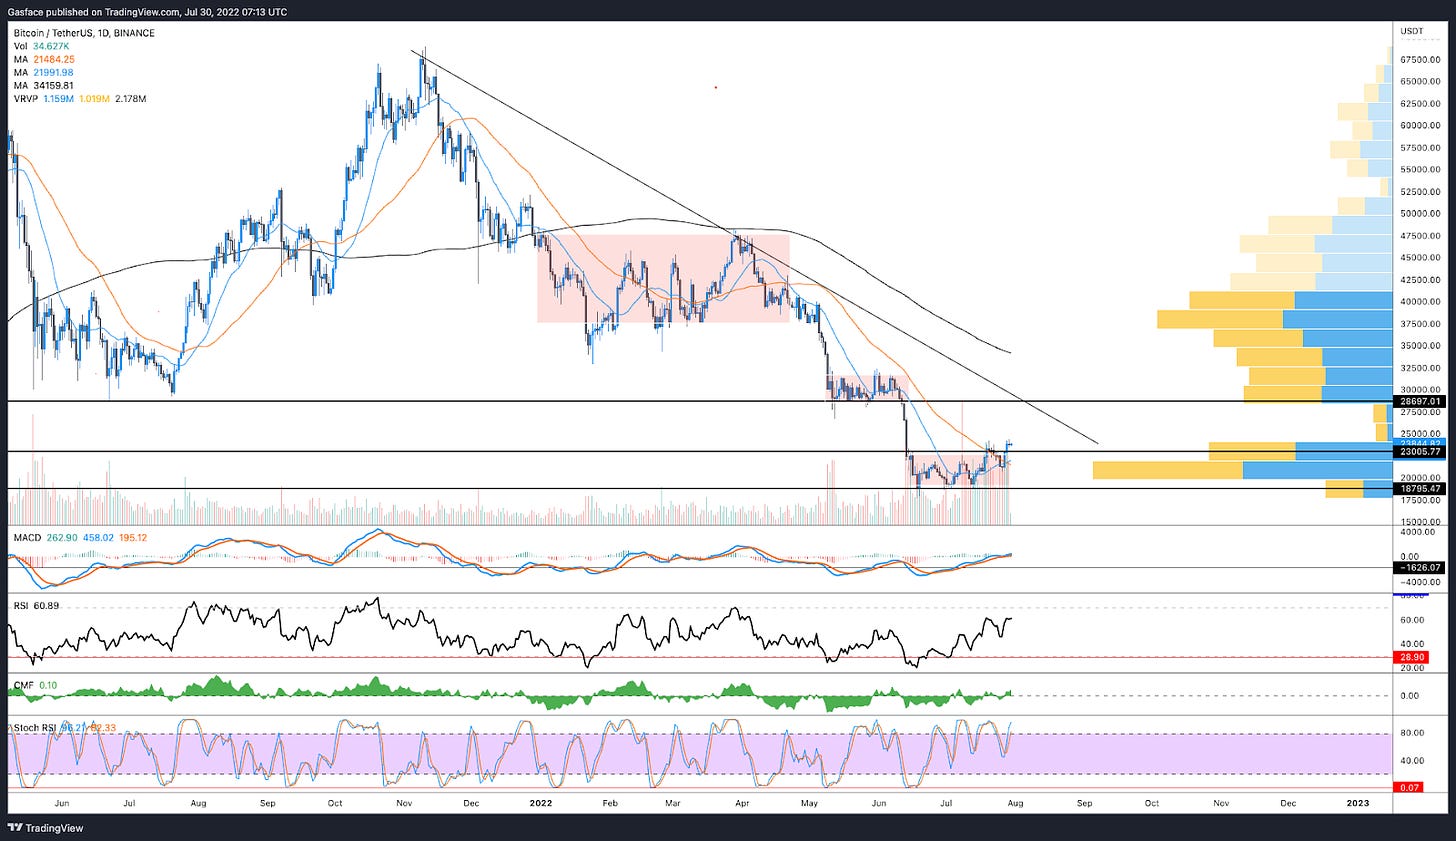
With this week’s retest of the $24,000 level and a slight break from the previous 43-day range, Bitcoin looks set for either more consolidation (which altcoins love) or possible upside continuation, something altcoins also love.
In short, some of these hoes are prolly getting sent! Hopefully…
Either scenario looks delightful, but before getting all bullish, let's take a moment to identify a few potential downside threats and catalysts. I’ll keep it short.
Bitcoin price is still in a clear downtrend, with resistance at $24,000 and again at $28,000. Draw lines as you may, but every descending trendline touch has been met with selling and a rejection at $28,000 could (depending on downside catalysts at the time) trigger a cascade down to the $15,000 to $12,000 zone where permabears have planned a victory dance.
The previous 2 consolidation phases, or fractals if you prefer, show similar market structure, as during the current range break at $24,000. History doesn’t repeat but it often rhymes. Key thing to watch for here is sustained volume in spot markets and open interest in futures and perpetual markets. Keep in mind that rising OI can’t immediately be equated with bullish sentiment.
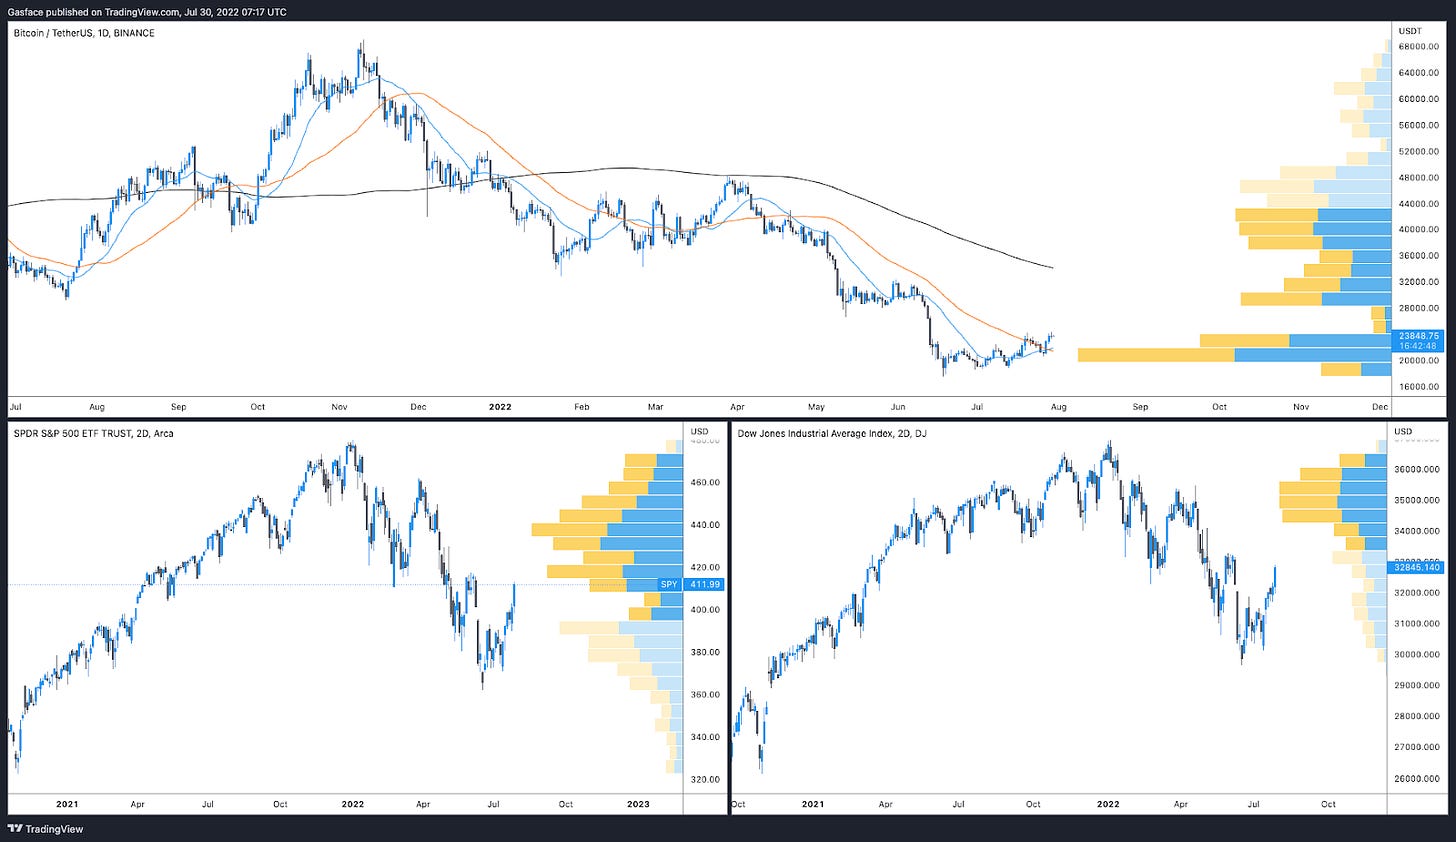
Crypto and equities markets broke out strongly after this week’s FOMC meeting and what are being interpreted as dovish remarks from Fed Chairman Jerome Powell, but the technical data shows the US in the early stages of a recession. Bear markets just don't end in 5 minutes or 5 candlesticks so it's important to remember the impact of Bitcoin and Ethereum’s correlation to equities markets and keep an eye on the price action on those charts.
The Ethereum network Merge. Bullish or bearish? There’s a lot of theories, and a lot of assumptions. Don’t get caught on the wrong side of that trade. Smart people are now discussing how a successful or unsuccessful Merge could impact the wider market.
There is a silver lining
Alright, so with that “bad outcomes” out the way, let’s zoom in and talk about the current confluence and possible chance of continuation.
Bitcoin is seeking continuation, but who knows if it will come. Fortunately, the predictable alternative is range-bound trading in the $24,000 to $18,500 range. That’s a pretty wide spread, and barring a Merge debacle or some sort of forced selling, price seems unlikely to drop below the lower part of that range.
Looking at the market structure of altcoins, one will note a tone of rounding bottoms, inverse head & shoulders patterns, bull flags and wide VPVR gaps. All are waiting to be exploited if BTC and ETH hold the current range. As the charts below illustrate, most altcoins are revving up for breakouts to their 200-day exponential and simple moving average.
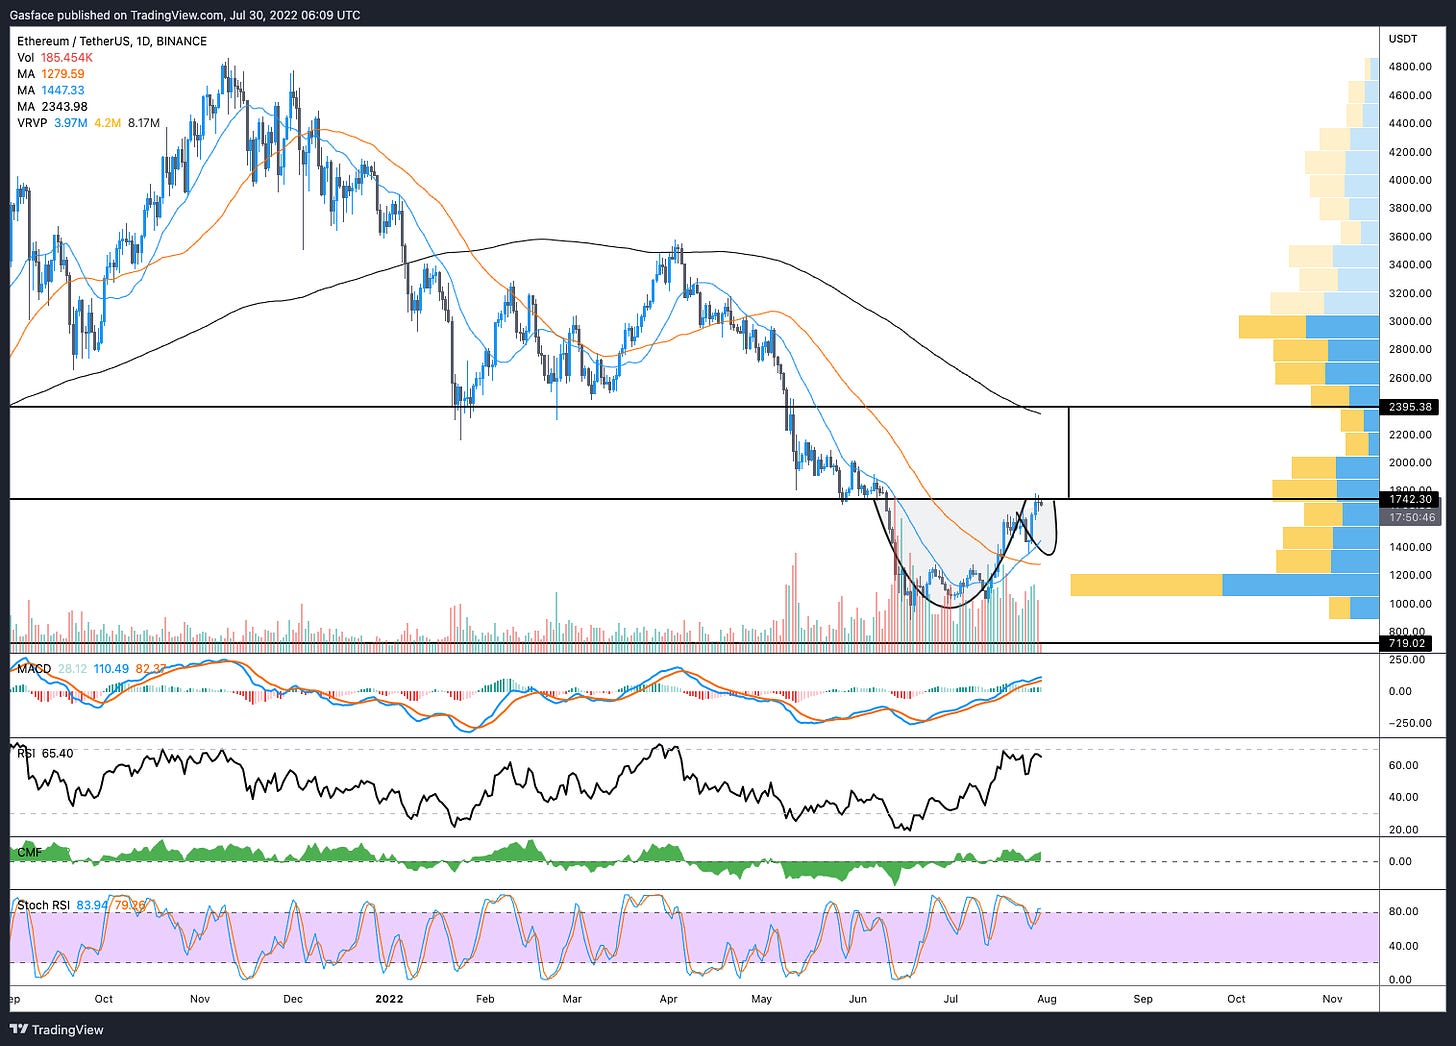
ETH is going for the good ole cup and handle pattern with a target at $2,000 to $2,300. Whereas rejection of the structure could see a downside move to the $1,300 to $1,500 level to build that “handle.”
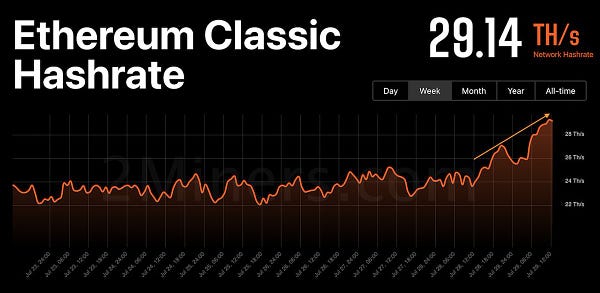
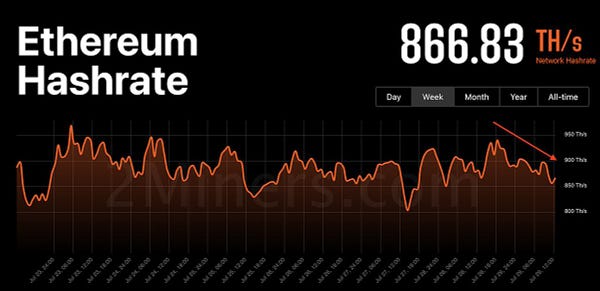
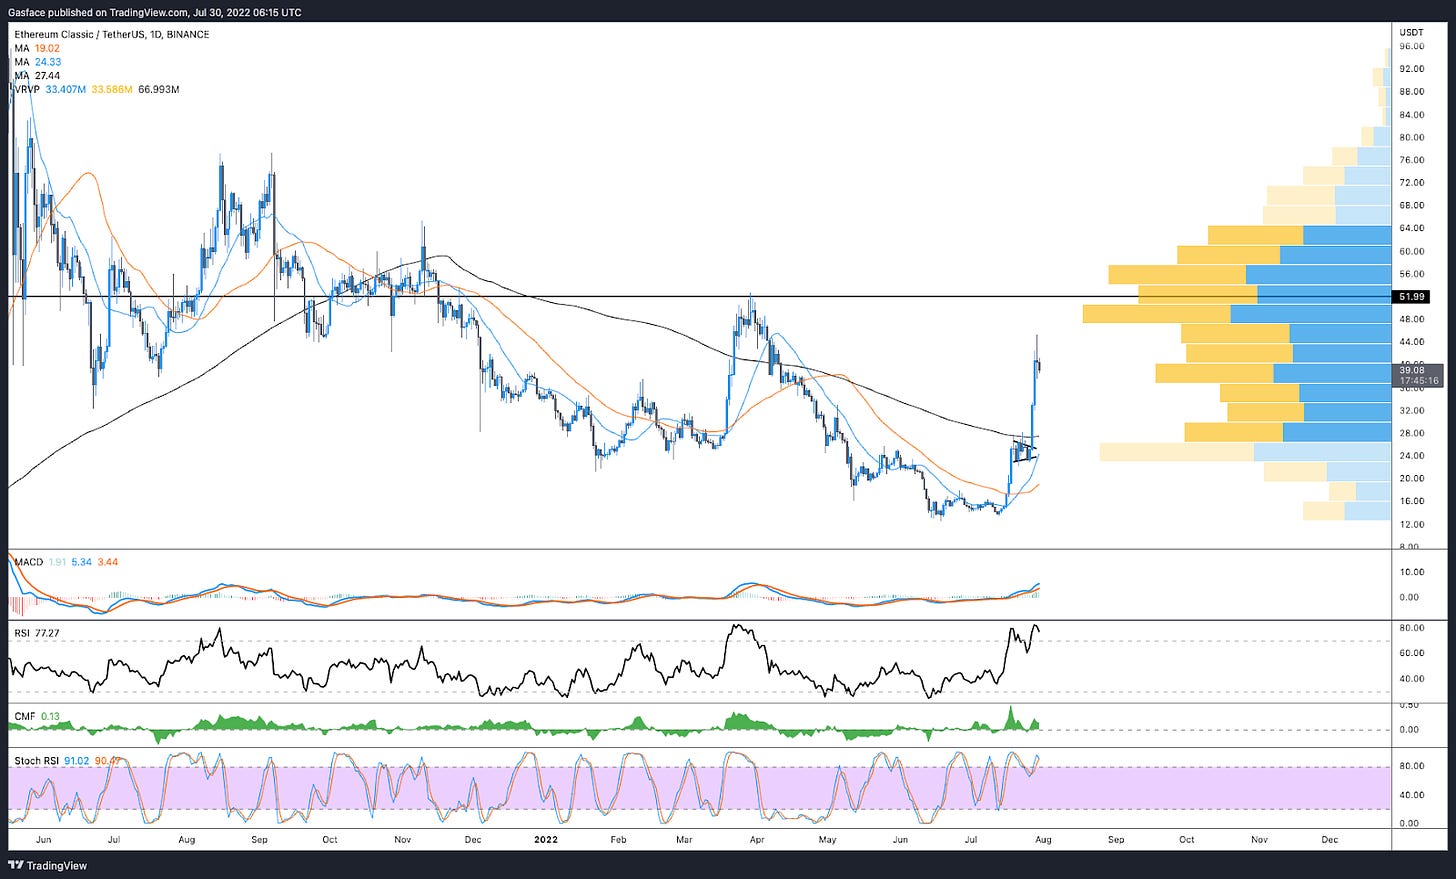
Ethereum Classic (ETC) bull flagged its way right through the VPVR gap as it smashed through its 200 SMA. Perhaps a telling sign for what to come from other altcoins with similar market structure. With Merge coming up, and rumors of miners considering a hardfork or switching chain, ETC could be one to continue watching.
While there’s not much going for the chain, the hashrate is hitting new all-time highs and any pullbacks to the 20-MA and 200-MA could get bought up. Let the trend be your friend and trade volume and direction not purely “fundamental.” Remember how ApeCoin broke out when it listed, volumes were massive, and it was a pretty easy directional trade.
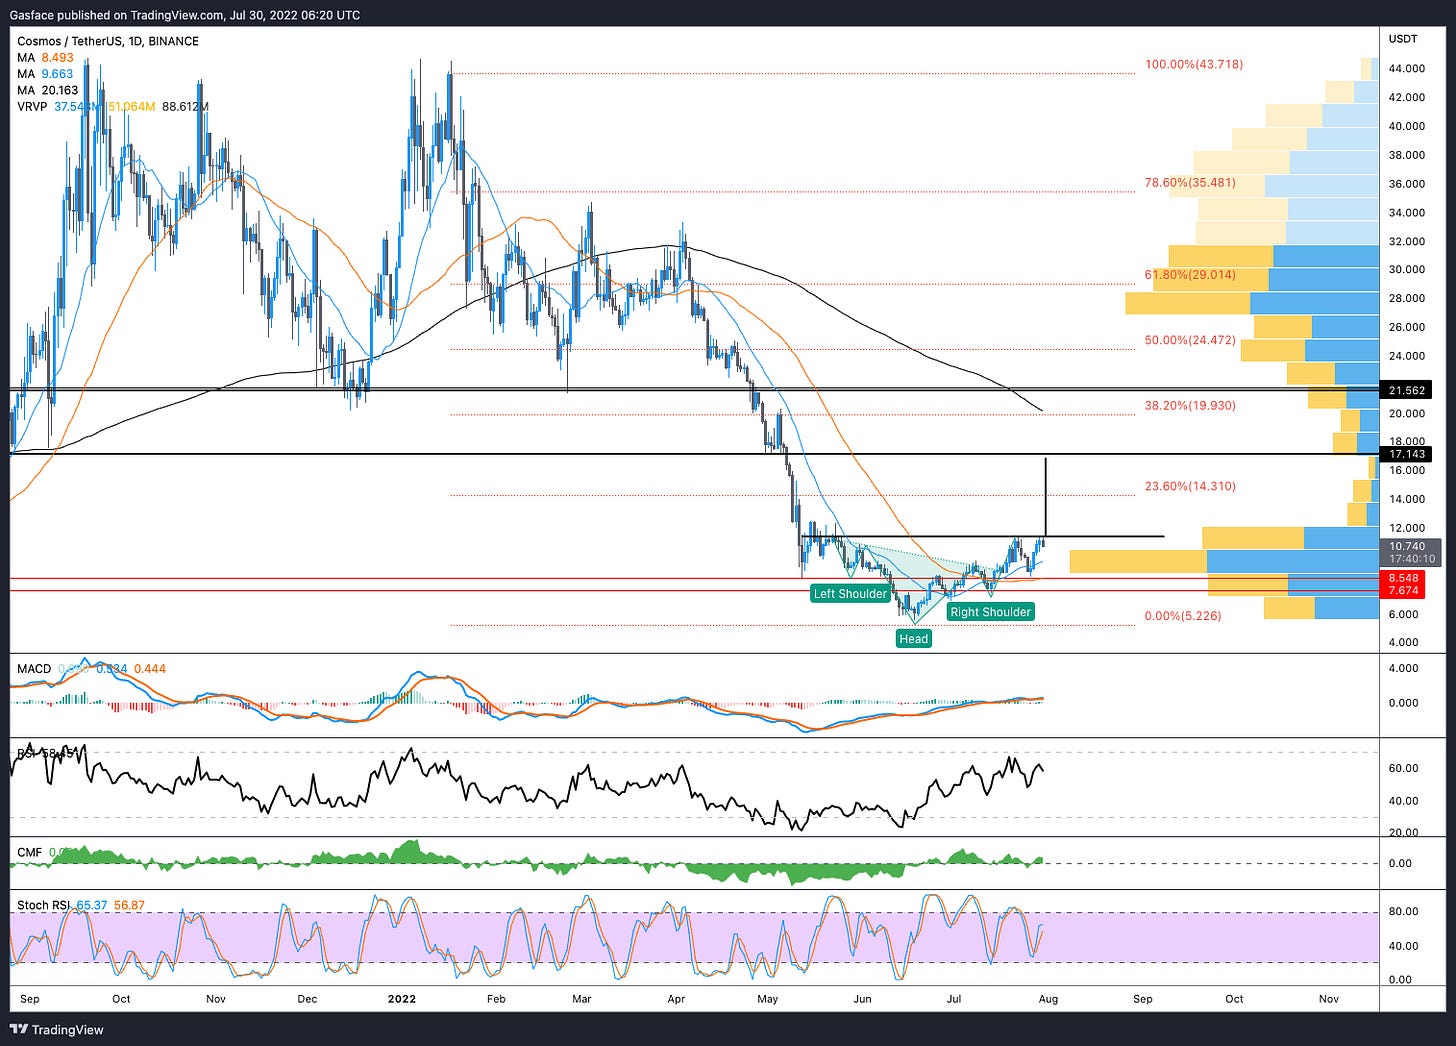
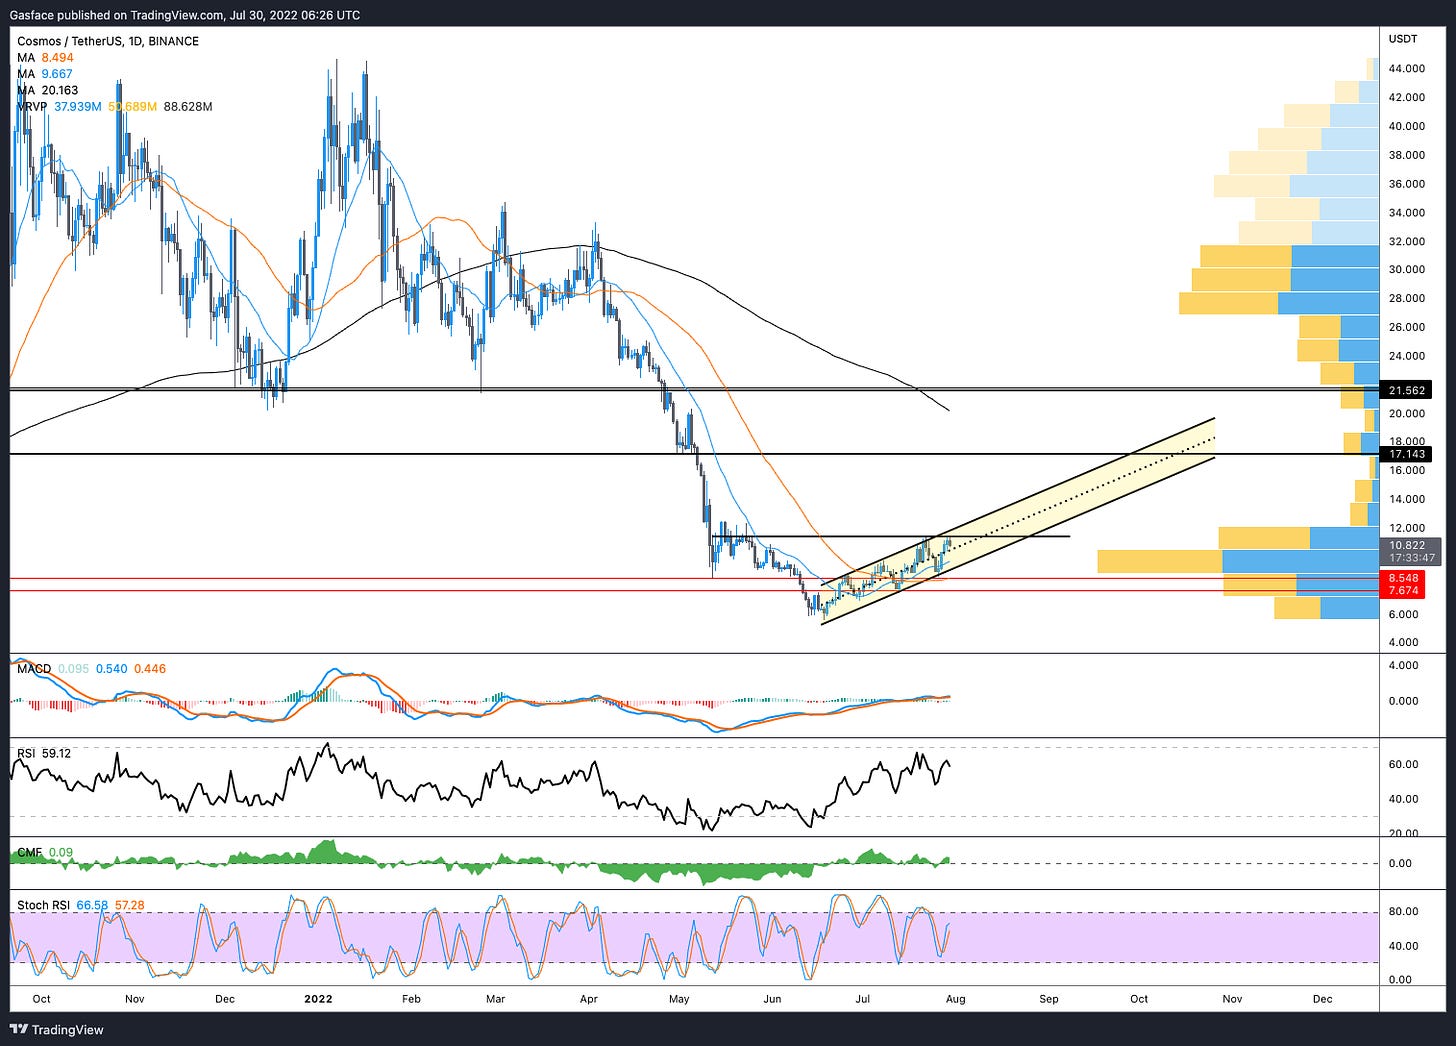
Cosmos (ATOM) completed a rather wonky inverse head and shoulders pattern and continuation would suggest a target at $16, whereas the potential trend of the 200-MA being hit by altcoins would imply continuation to $20. Not financial advice, just what the market structure and technicals point to if the “confluence of continuation and consolidation” continues.
As an alternative view, ATOM also trades in an ascending channel, which if maintained, could see price extend again toward the $20s, filling the VPVR gap that extends from $12 to $27. Gap traders might wait for ATOM to clear the current range above $12, before chasing price to the 200-MA at $20, which reflects a hefty 74% gain.
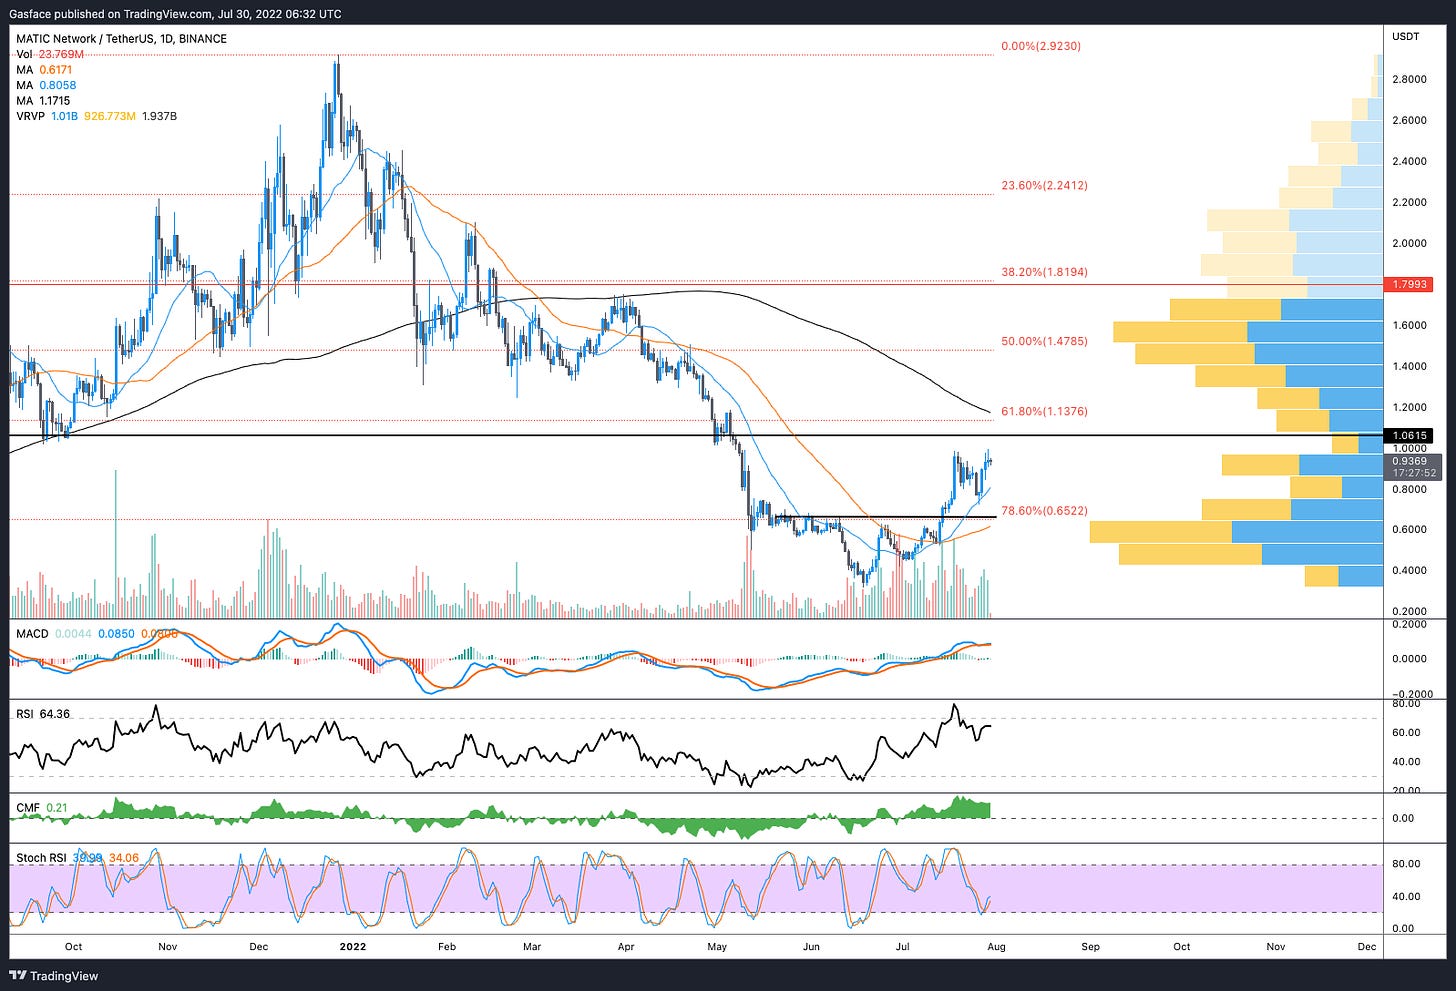
Polygon (MATIC), is another recent mover that saw a strong inverse head and shoulders breakout, retested the 20-MA at $0.72 and now seeks continuation to its 200-MA which is aligned with the 61.8% Fibonacci retracement level at $1.13. Another simple continuation-based VPVR gap fill.
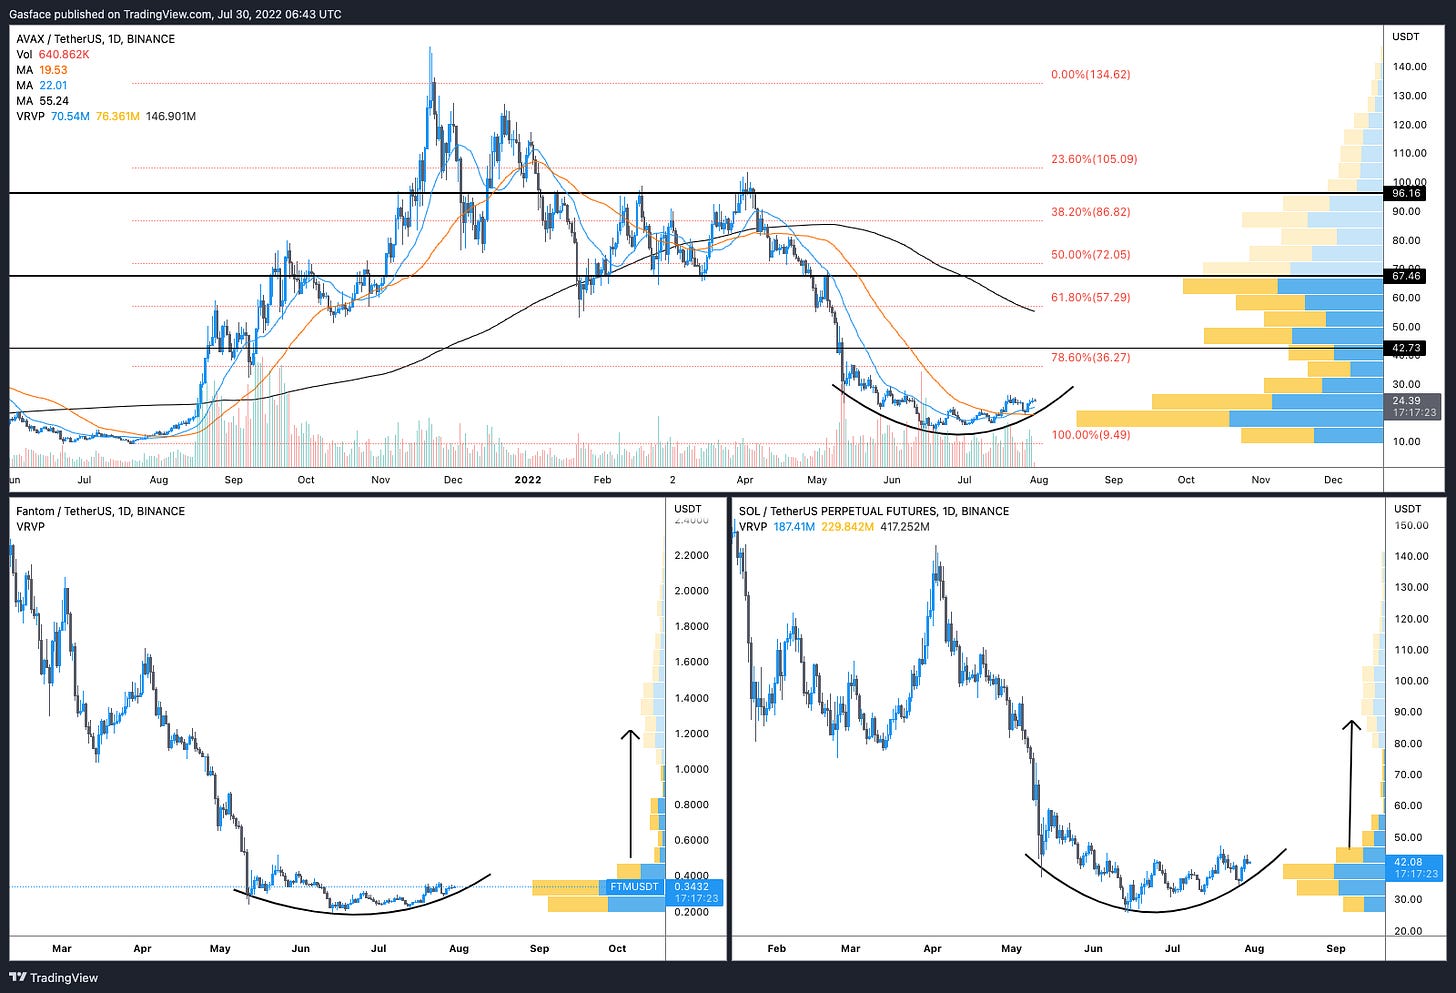
Meanwhile, Avalanche (AVAX), Fantom (FTM) and Solana (SOL) are all showing nice “rounded bottoms” and increasing volumes, which are signs that consolidation and accumulation are likely taking place.
To wrap up. At the moment, there are a TON of altcoin charts that are showing identical market structure. They all show increasing volumes, substantial size VPVR gaps, continuation patterns that suggest the wider market has hit a macro bottom, and the potential for 30% to 100% upside. That’s great, but be careful not to be lulled into complacency and remember the 4 downside threats mentioned at the start of the article.

Unless you’re cash flush, with some serious capital to spare, let’s say north of $100K, now isn’t the time to blindly ape into every position that hints at a breakout. That’s the perfect way to get REKT fast. It’s much better in a strong bear market to identify 2 or 3 really great projects that have strong fundamentals and an active development team and dollar cost average into those while keeping a price agnostic stance. We have no clue what unforeseen catalyst can spring up and alter the burgeoning bullish trend taking hold of the market at this moment in time.
If one must trade, then focus on just a few assets, rather than spreading oneself too thin, and set alarms that confirm that a breakout has occurred before choosing to go long. Expect to sell the first tap of the 200-MA (I usually set sell orders 5 to 10% below key moving averages like the 200-MA) and then wait on the retest and confirmation of lower support which is typically at or slightly below the 20-MA before hopping back into those trades for the continuation bounce.
Moral of the story is, sure, a massive amount of charts look quite enticing at this moment, but be wary of the weekend’s thin volume and order books and remember that too much confluence can trigger confirmation bias that leads to over investing and over trading.
Until next time, happy trails. Bear markets really aren’t for high frequency trading unless you enjoy that sort of pain. So go perfect your dry rub and have a go at smoking a brisket or some cherry wood beer can chickens!
Follow my grilling adventures and trades @big_smokey1 on Twitter and see my pnl from the $500 starter account.


