Ladies and gents.
Apologies for the break in comms. I know it’s been a hot minute since an update was posted.
In the past two months I’ve been a guest writer for a weekly newsletter at Cointelegraph and that coupled with the arrival of the holiday season and the unending crypto black swan events have made keeping the bi-monthly pace of this Substack a challenge.
Nevertheless, I’m back, so let’s dig into what’s going on.
More of the same
From the price action perspective, there’s not much going on.
To the surprise of few, the market is still in a downtrend.
Traders continue to hold a risk-off stance in fear of the undiscovered corpses that have yet to turn up from the FTX / Alameda / Genesis / BlockFi insolvencies.
Evidence of this comes from the aggregate open interest and Binance open interest for Bitcoin futures which remains a shadow of what it was in late 2021, although the metric is rising in the short-term.
While the FTX blow up could have been the catalyst for washing out the final remnants of hidden leverage that remained in a highly levered market where market makers and centralized exchanges commingled their own reserves with client and retail investor funds, investors and regulators are still quite wary of cryptocurrency.
Sam Bankman-Fried, Alex Mashinsky, Do Kwon, Su Zhu and a handful of similar style hucksters have really done damage to the market and investors' confidence in crypto.
This blow will be hard to recover from that’s for sure. I’ve endured three bear markets and what I’ve learned is that when the darkest days arrive, it’s also a time to get curious and start looking around to see what sort of green shoots emerge from the scorched landscape.
I’ve just wrapped up my monthly charting and here are a few ideas which came to mind…
Nothing is set in stone and these aren’t price calls. I’m just pointing out a few interesting developments in an otherwise down market.
Ethereum finds some footing
The Ethereum (ETH/USD) pair appears to be forming a bull flag on the weekly timeframe.
At the same time, the ETH/BTC weekly timeframe showed some interesting developments. Depending how you see it, there could be a nice inverse head and shoulders forming.
Alternatively, one could also argue that the ETH/BTC weekly is flashing a massive cup and handle pattern.
Another intriguing development is the Super Guppy indicator in the ETH/BTC weekly pair has been bright green since August 8, nearly 4 months ago.
It’s also bright green in the daily timeframe, where one can also spot an inverse head and shoulders pattern.
There seems to be quite a bit of sustained confluence between the ETH/USD and ETH/BTC pair, which is interesting given the state of the market.
Despite this short-term bullish outlook, concerns over Ethereum blockchain censorship, OFAC compliance, ETH’s performance in its supposed deflationary post-Merge environment and worries over whether the SEC and CFTC will change their perspective on ETH being a commodity remain.
And with most cryptocurrencies down 60% to 90% from their 2021 high, its eyebrow raising to see ETH flashing some bullish signals.
Like what you’re reading? Please share and follow my Twitter for regular market updates!
But TA is “backward looking…”
Nowadays when it comes to trading, technical analysis, macro and equities analysis is only half the story. On-chain data also provides some useful signal on what type of activity, or lack thereof, is happening with a particular asset.
According to data from Glassnode, since November 7, ETH addresses with a balance greater than 32, 1,000 and 10,000 ETH have been on an uptrend.
While the rebound is minimal, growth metrics like new ETH addresses, daily active users, increases in an assortment of balance cohorts, and % of holders in profit are important to keep an eye on as they could highlight a change in trend and sentiment.
Contrast these metrics against trading volumes, price and other technical analysis indicators in order to develop a more comprehensive view of whether opening a position in ETH is a good idea.
We can also see ETH’s MVRV Z-Score in interesting territory. Similar to Bitcoin on-chain analysis, the metric examines the current market cap of the asset versus the price at which investors purchased.
It can suggest when an asset is over and undervalued relative to its fair value. The metric tends to signal market tops when the market capitalization is significantly higher than realized cap.
Looking at the 3-year MVRV Z-Score chart below, we can see that the Z-Score is back in the green zone
Given the market uncertainty, unresolved threats of insolvency, bankruptcy, contagion from these crypto company collapses and pending regulation, it’s hard to conclude that it’s time to go long on ETH.
Risk averse traders who are looking to pull the trigger might consider going spot long and short via futures contracts. That way, if you’re long-term bullish on ETH, then you’re building a position, while also hedging against the short-term downside via futures.
Let the halving hopium begin!
Here’s another altcoin that caught my eye recently.
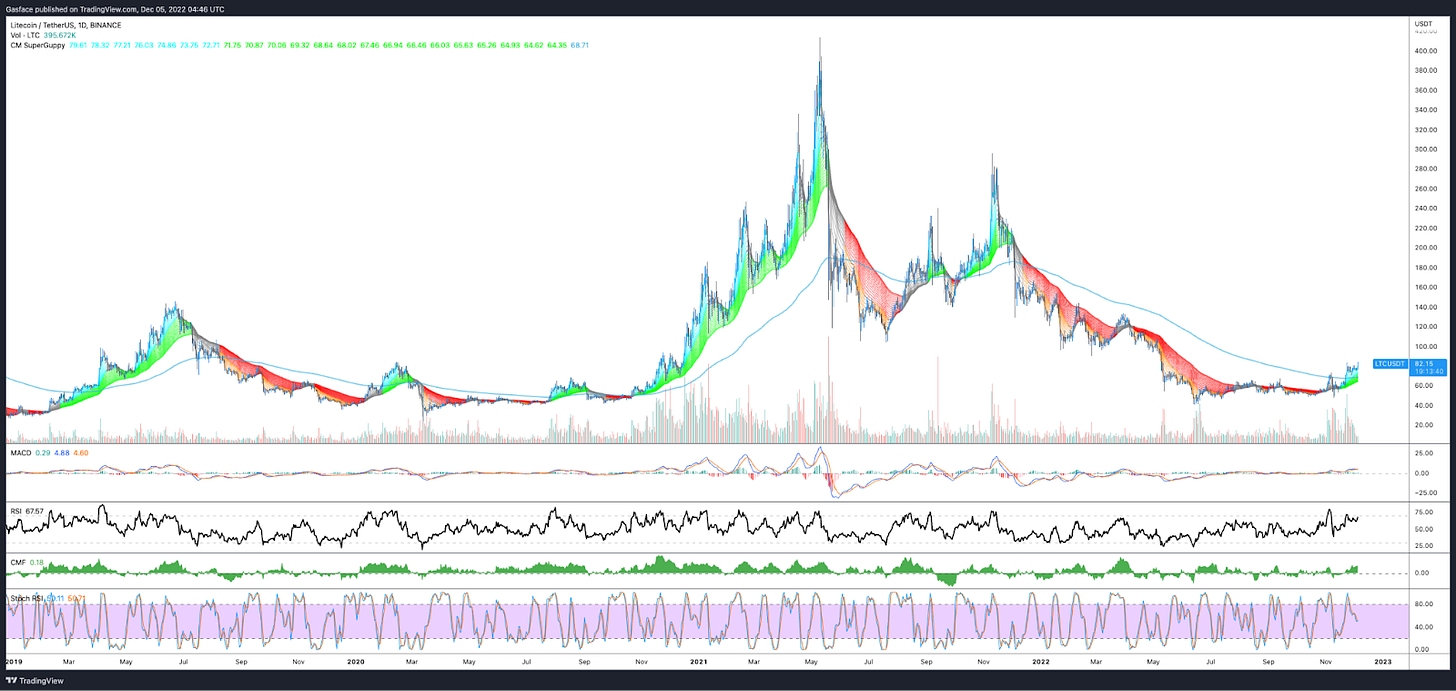
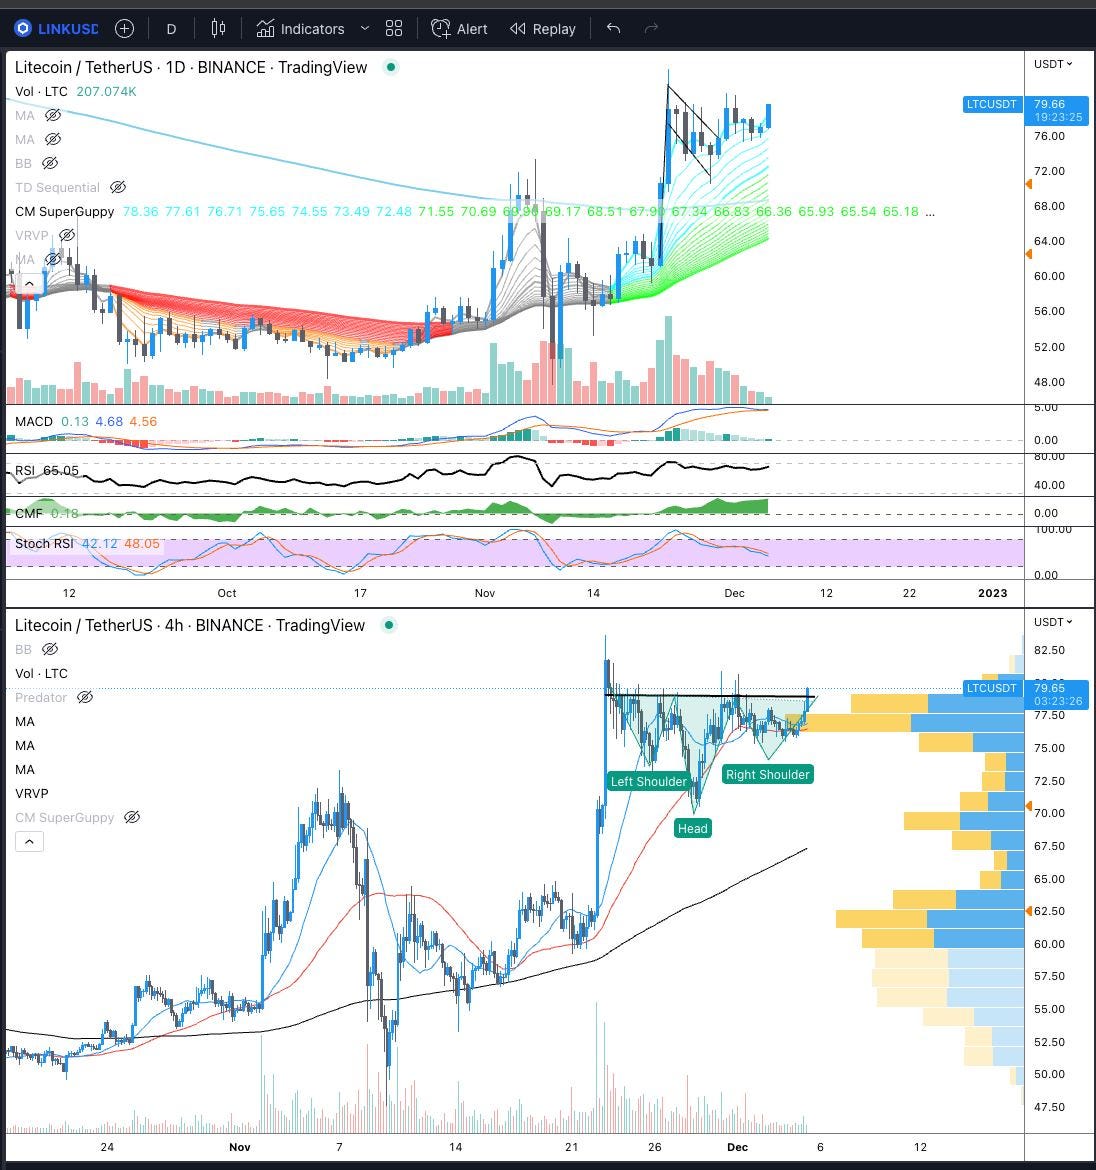
The Super Guppy on the Litecoin/USD pair has turned green, something that doesn’t happen very often.
On the daily timeframe, a bull flag broke out and LTC price saw strong continuation. Meanwhile, on the 4-hour timeframe an inverse head and shoulders pattern successfully completed in the same time.
The most likely culprit behind the move is the approach of the third Litecoin reward halving which will see the block reward reduced from 12.5 LTC to 6.25 LTC.
Being a fork of Bitcoin, Litecoin also has a tendency to get bullish several months before the halving takes place and this was the case in 2015 and 2019.
But what about Bitcoin?
Bitcoin is pretty much always the canary in the coal mine and the super massive black hole with a gravitational pull that impacts the pricing of all other cryptocurrencies.
So, while ETH is flashing some compelling signals, Litecoin is providing some prehalving hopium and Chainlink (LINK) and ApeCoin (APE) are revving up in preparation for staking, it’d be foolish to ignore Bitcoin’s price action and market structure.
In my view, Bitcoin price is in a falling wedge with resistance around $19,500 and support in the $15,500 to $15,000 range.
If price follows the current trajectory of bouncing around the support and resistance trendline of the falling wedge, and no new cataclysmic news about some major crypto market maker, CeFi or DeFi provider or surprise executive regulatory action taking place against crypto occurs, perhaps traders will have the confidence to open some longs in ETH and smaller cap altcoins.
I personally expect BTC to encounter selling at the $20,000 level and I assume that this would be followed by lower support retests in the low $16,000 range.
If BTC did somehow manage to flip the $19,000 to $20,000 level to support, that would be encouraging but my view is price is likely to continue consolidating until some of the BTC pre-halving hype begins to take shape in Q2 / Q3 2023.
Follow my grilling adventures and trades @big_smokey1 on Twitter.
The views expressed here are not intended to serve as trading advice. The author is not paid to analyze any of the assets mentioned above and know that I may or may not hold positions in the mentioned assets. Please be safe and DYOR.


