Patience is a virtue
Investing can be a drawn out game of “hurry up and wait.” Here’s why you should wait.
There’s been a lot of chatter about the possibility of the Federal Reserve making a “pivot” where they deviate from the current game plan of quantitative tightening and interest rate hikes to balance the books and put a cap on runaway inflation.
After the most recent Federal Open Market Committee (FOMC) meeting, investors and media interpreted the regulators’ statement as “dovish” and the DOW and S&P 500 have been on a tear since then.
The idea of stopping rate hikes is the exact fodder fueling the hopium of a handful of crypto analysts who imagine that a Fed pivot and the current rally seen in stocks, will trigger a reversal in Bitcoin and altcoin prices.
Of course, nobody, not even Fed Chairman Jerome Powell, has a crystal ball, so it’s fair to say that literally anything could happen. Right now, several economic indicators suggest that the United States is in a technical recession, and given the correlation between Bitcoin and equities markets, it’s concerning that:
Bitcoin is struggling to break from range as the S&P 500 and DOW surge
Longer term projections continue to raise concerns and it takes time for the various measures of economic health to manifest as tangible outcomes in the economy.
If you’re hearing those calls for a renewed “bull market” and getting hot and thirsty, think twice before going all ape. Let’s see how next week’s Consumer Price Index (CPI) print looks and what impact this has on the Fed language and signaling for the next rate hike. These actions will add a bit more clarity to the discussion of whether the Fed will deviate from its current course of action.
Anyhow, let’s not spend too much time in the thick of speculation, doom and gloom.
Touching back on the topic of last week (Will Bitcoin and the wider market see continuation?)
By the way, if you liked that post, then why don’t you subscribe? The newsletter comes out twice per month so it won’t be too much of a heavy lift!
Will the “continuation” continue?
Even with the drama and potential for continued downside, confluence and consolidation are still in effect for BTC and many altcoins.
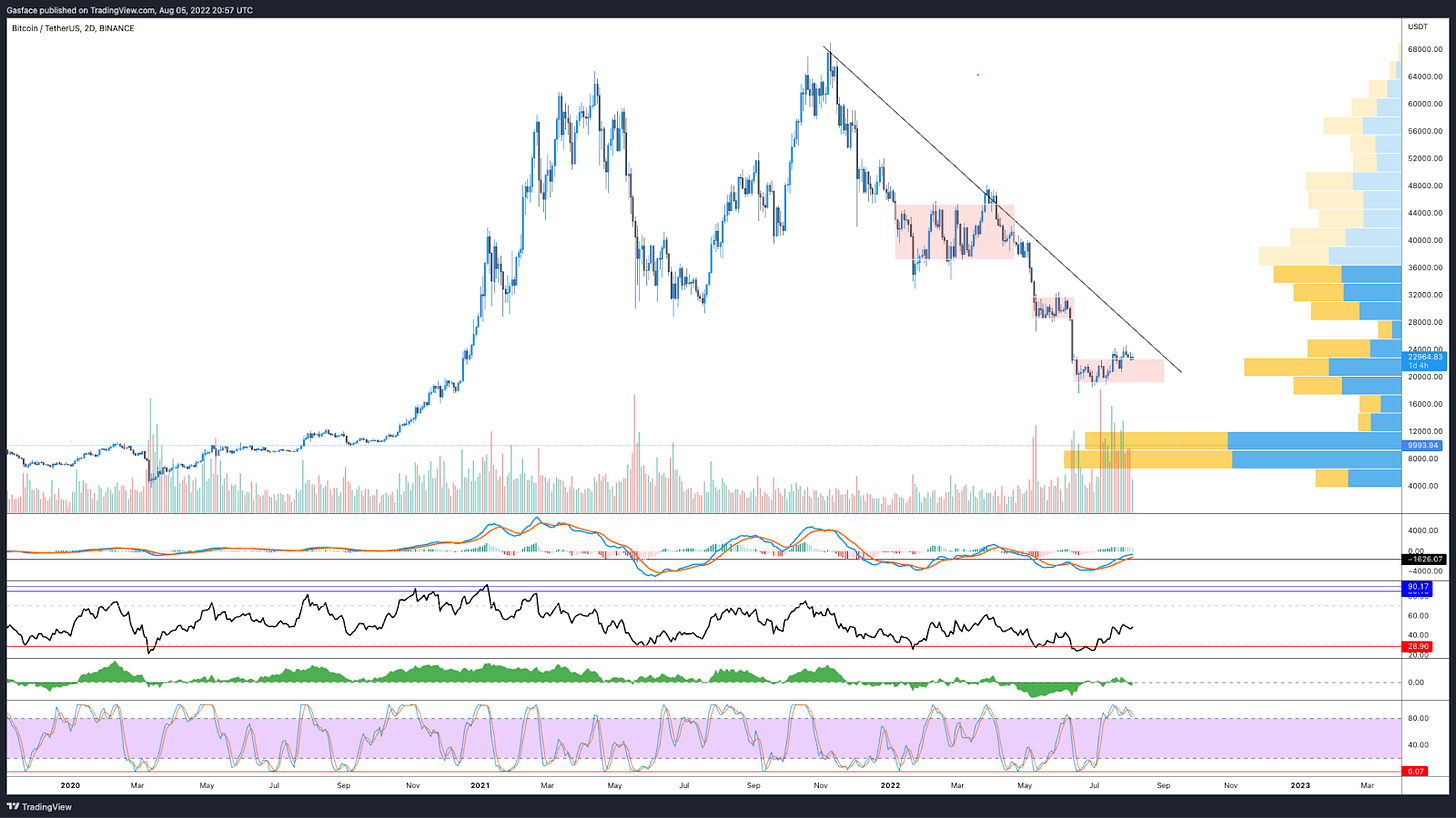
Despite multiple attempts to flip the $24,000 level to support and a few recent breakouts above it, BTC essentially still trades in the same $18,000 to $23,000 range, just at the top of it now. From a higher timeframe point-of-view, BTC price also continues to make lower highs.
BTC/USDT daily chart
Sure, within the current range we have a series of daily higher highs and some analysts will point out the 5 to 10 day interval structures as bull flags, but I’m not a day trader so it's irrelevant to me.
The weekly timeframe shows some weekly higher highs as price bounced from its swing low at $17,600 and this is encouraging, but what I’m saying is, from the perspective of Bitcoin’s market structure from the Nov 10, 2021 all-time high at $68,900, the asset continues to make lower highs and each lengthy consolidation phase has eventually crumbled at the higher range resistance to paint new lows.
The point here is not to debate whether Bitcoin’s bottom is in or when the downtrend will end. Multiple on-chain and derivatives metrics suggest that BTC is a buy in the current range and that smart money is starting to turn bullish (even if they are not “buying” per say). The goal here is to analyze the impact of consolidation and identify possible long positions and dollar cost averaging opportunities in Bitcoin, Ethereum and altcoins. This is where the real money is made, during bear markets, when prices are stuck in prolonged sideways chop and volume data points to accumulation.
You know, buy the bottom, sell the top.
Let’s review a few things to see where we are:
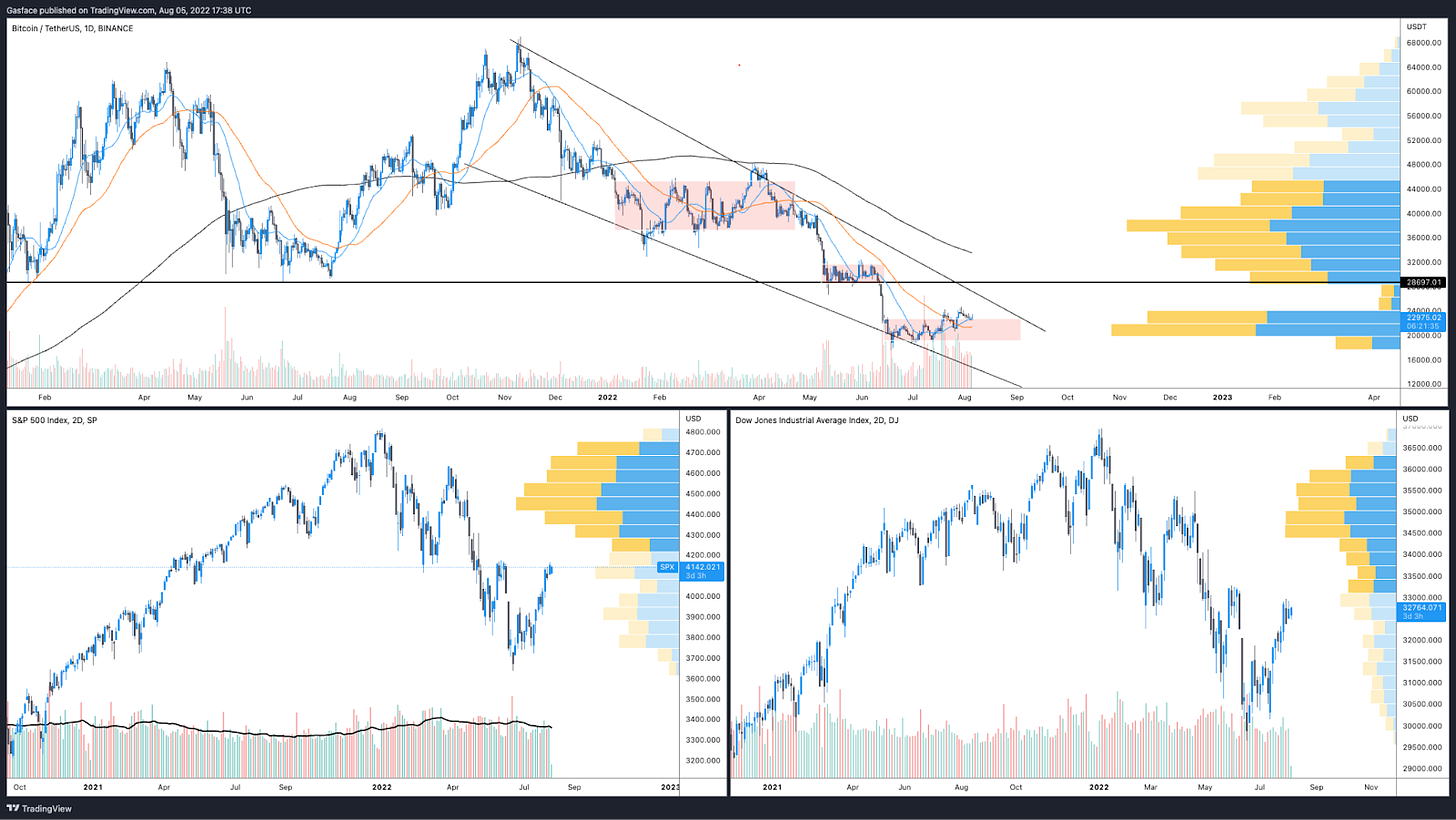
The S&P 500 and Dow have bounced strongly from swing lows and continue to etch out gains on a near daily basis.
BTC, S&P 500 and Dow Jones Industrial Average price action. daily chart
From the perspective of technical analysis, a daily higher high has yet to be secured, but both indices appear on the verge of making it happen. Typically, resistance occurs at these necklines, but if breached, most analysts expect continuation. There are rumors of a “bear market rally” and historical data shows the possibility for such an event. Have a look at these tweets for additional context.
What’s interesting is that BTC has a known high correlation to equities markets, so if SPX and DIJA are rising, shouldn’t BTC price also rise, break through that $24,000 resistance and snatch the liquidity all the way up to $28,000?
It’s a bit concerning that BTC price action is not following that of major indices. Bitcoin was the canary in the coal mine that reflected the projected impact of the Fed’s planned interest rate hikes in late 2021, ie, BTC price softened and entered a downtrend as the Fed confirmed its plan to tighten and boost rates. Currently, the wider economy remains in trouble and inflation remains a real challenge, meaning the Fed is likely to continue with 0.75 and 0.5 BPS hikes for the foreseeable future until the inflation target of 2% is reached (remember last month was 9.1%. Quite a ways to go innit?
So, if Bitcoin price action was the canary in the coal mine in late 2021, then is the current price action and its inability to follow the astounding recovery of SPX and DIJA a signal that we should pay close attention to? I think so.
It should be noted that SPX and DIJA are up 14% and 10.6% off their swing lows, while BTC is up 33% from its supposed “bottom” at $17,600. So the correlation certainly is not broken, and there are many crypto-specific ways to explain the lag in BTC’s current price action at the $24,000 level.
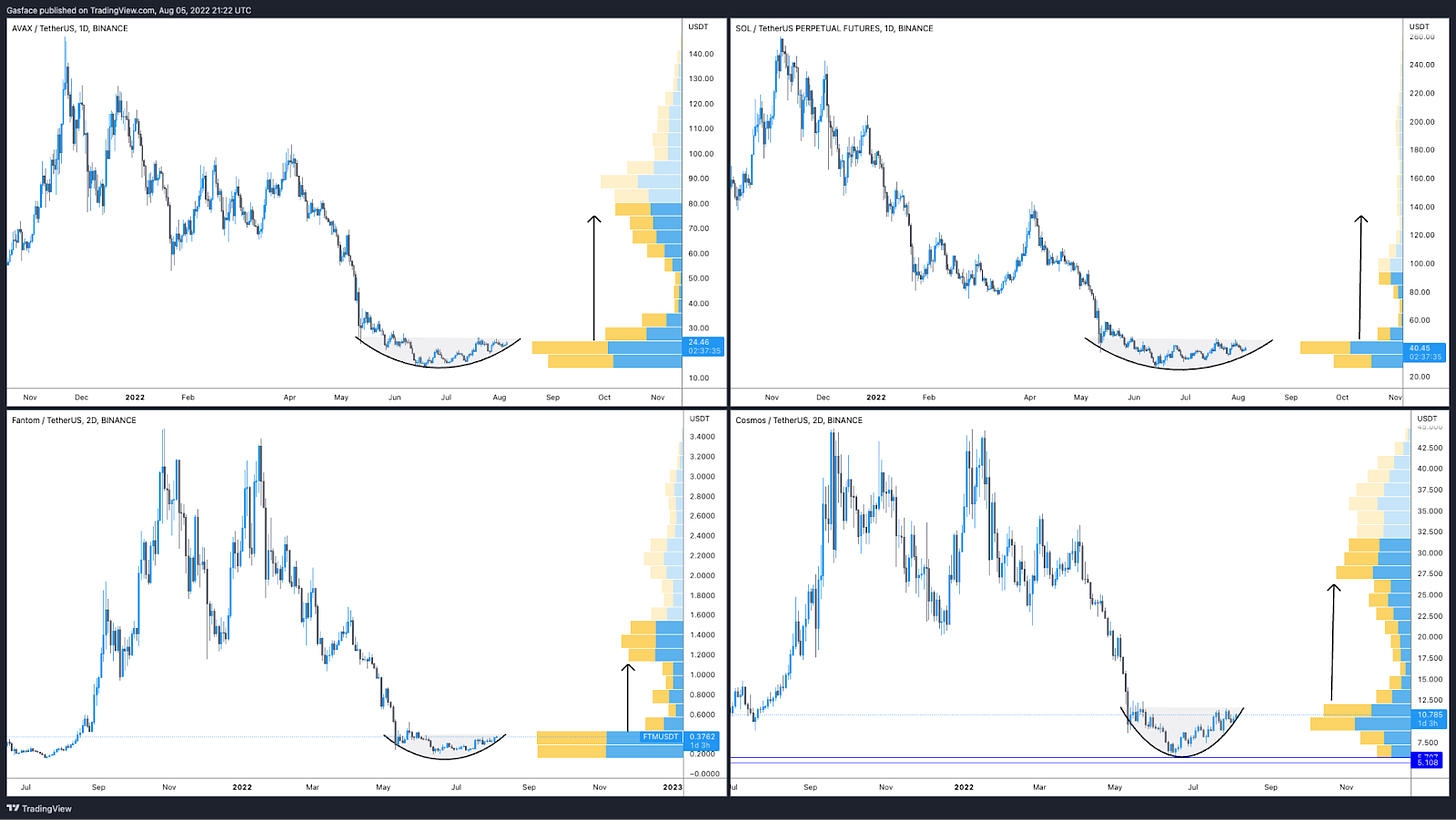
Meanwhile, altcoins continue to consolidate. Let's take a quick look at those discussed last week: AVAX, FTM, SOL, MATIC, ETH, ATOM.
AVAX, SOL, FTM and ATOM. daily and 2-day charts
For Avalanche (AVAX), Solana (SOL), Fantom (FTM) and Cosmos (ATOM) that’s a lot of rounding bottoms isn’t it? These structures are typically found near the end of a prolonged downtrend and hint that accumulation is happening ahead of a trend reversal.
Of course, looking at the Bitcoin chart from the 2018-2020 crypto winter is a reminder that consolidation and accumulation periods can last for a really long time. Which is exactly why dollar cost averaging in a price agnostic manner is the attitude to adopt when looking at cryptocurrencies.
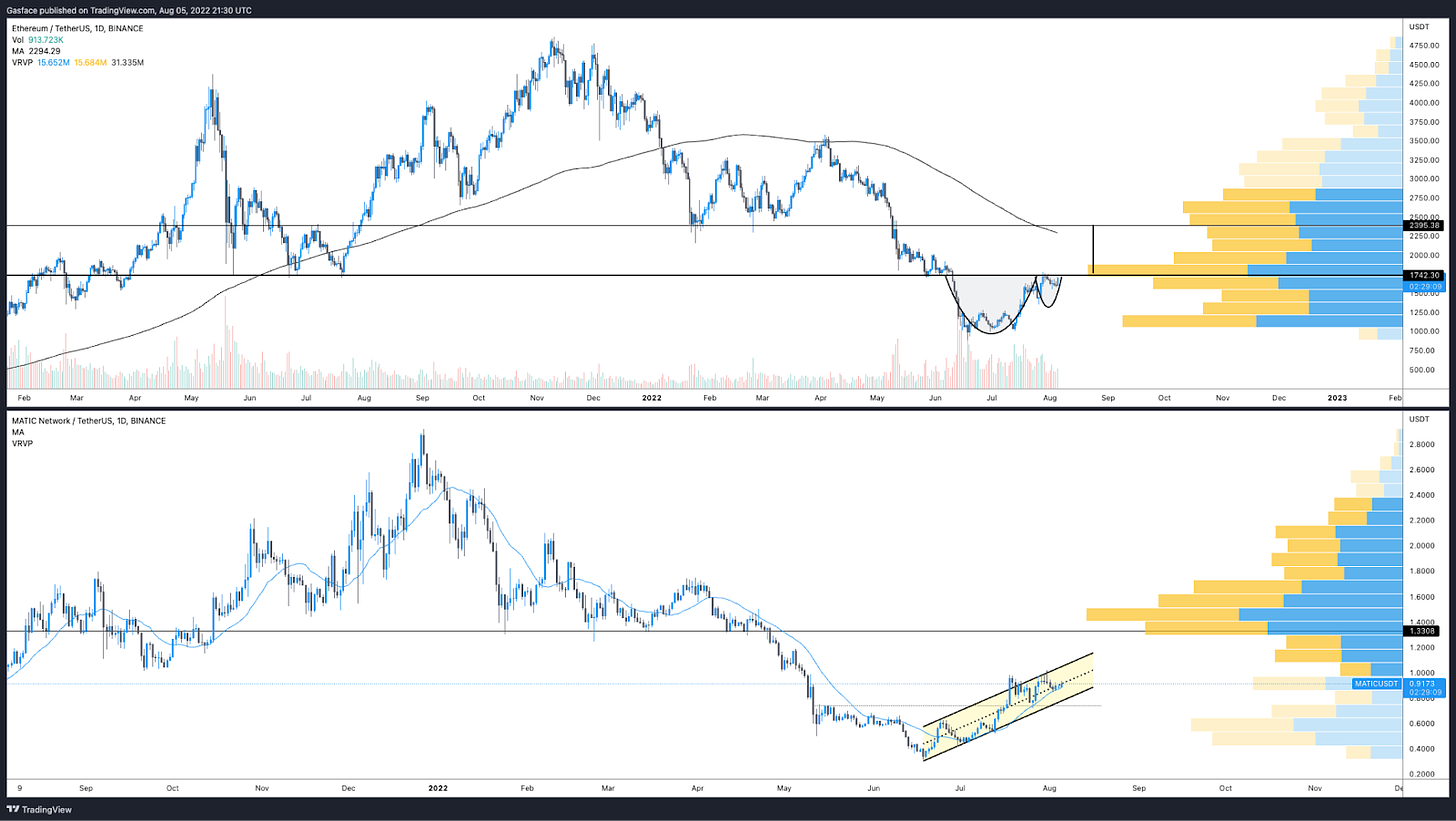
ETH and MATIC daily chart
Ethereum (ETH), on the other hand, continues to shape up nicely in the cup and handle-like structure and MATIC now trades in a nice ascending channel after successfully rallying out of a inverse-head and shoulders pattern a few weeks ago.
So, if we backtrack to last week’s analysis, the trend of confluence, consolidation and possible continuation remains in effect. A ton of altcoins are showing similar rounding bottom, inverse head and shoulders, cup and handle and ascending channel patterns on charts that also show massive volume profile visible range (VPVR) gaps. Price tends to chase after liquidity and the market is just awaiting a catalyst to prompt that breakout…or breakdown.
Opportunity abounds and smoked chicken is DELICIOUS
Look at that bird! Smoked for three hours over a Cherry x Apple wood mix and seasoned with Suckle Busters Honey BBQ rub.
Anyhow…
Before wrapping up, let’s take a quick peek at other coins that are flashing bullish structures and early accumulation signs.
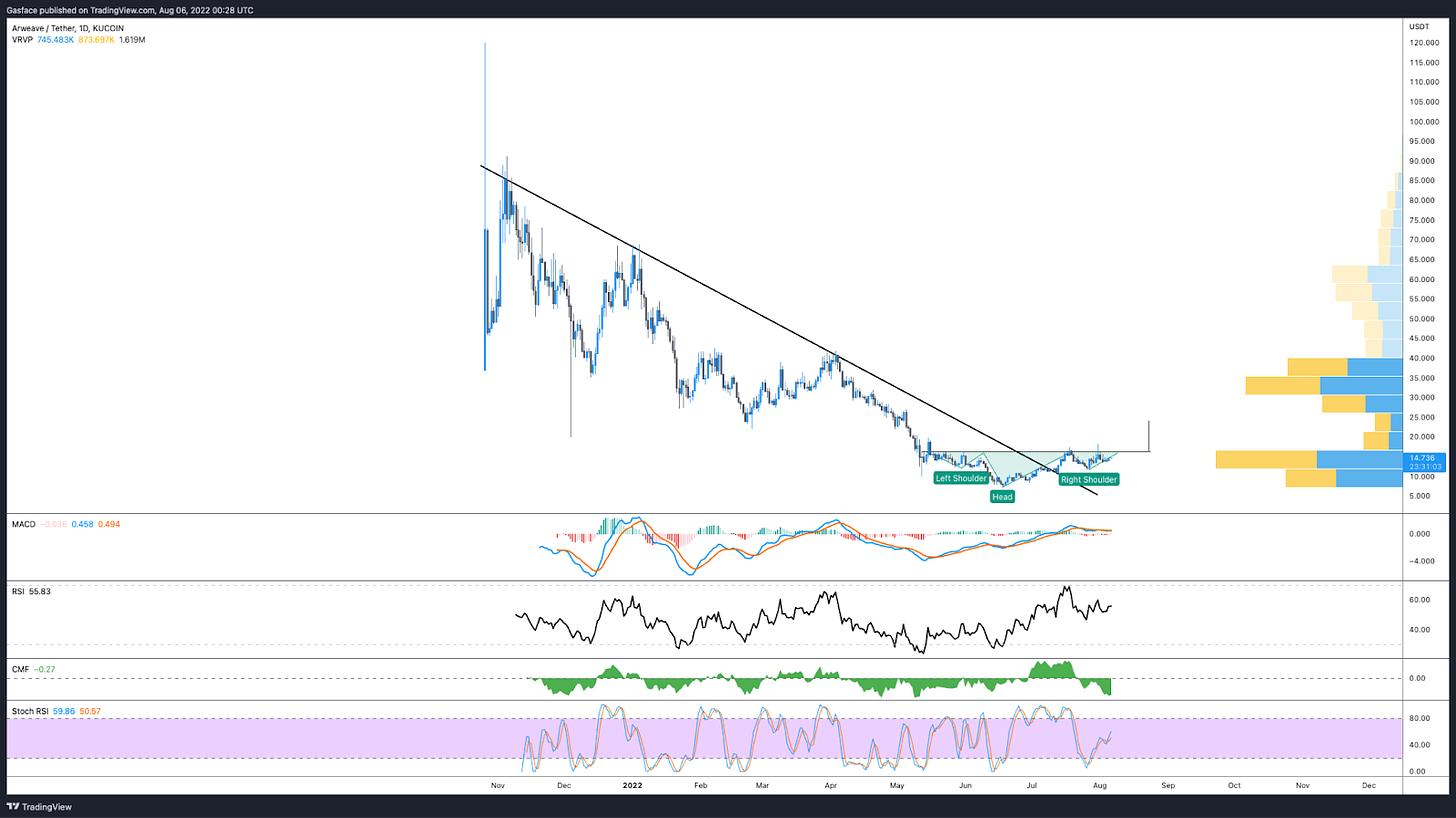
AR daily chart
Like MATIC, Arweave (AR) has a rather oddly shaped inverse head and shoulders pattern on it that could hit a $24 to $30 target if it completes.
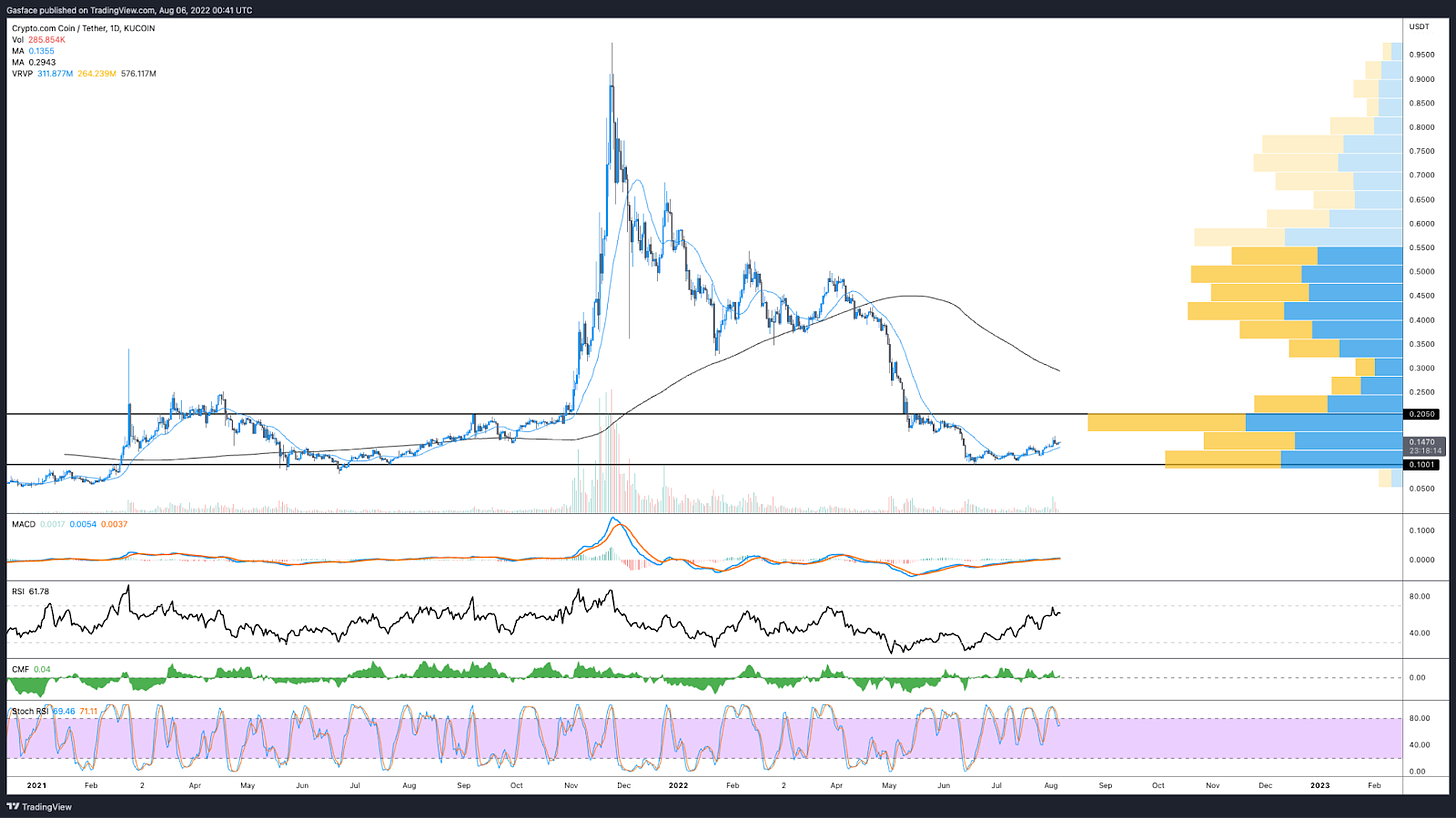
CRO daily chart
Crypto.com (CRO) token looks interesting. There’s lots of potential upside after the $0.21 resistance and historical data shows exchange tokens are known to moon in tandem. For reference, take a look at Kucoin Shares (KCS) and Binance Coin (BNB). Crypto.com has a growing ecosystem and lots of revenue, perhaps one to watch.
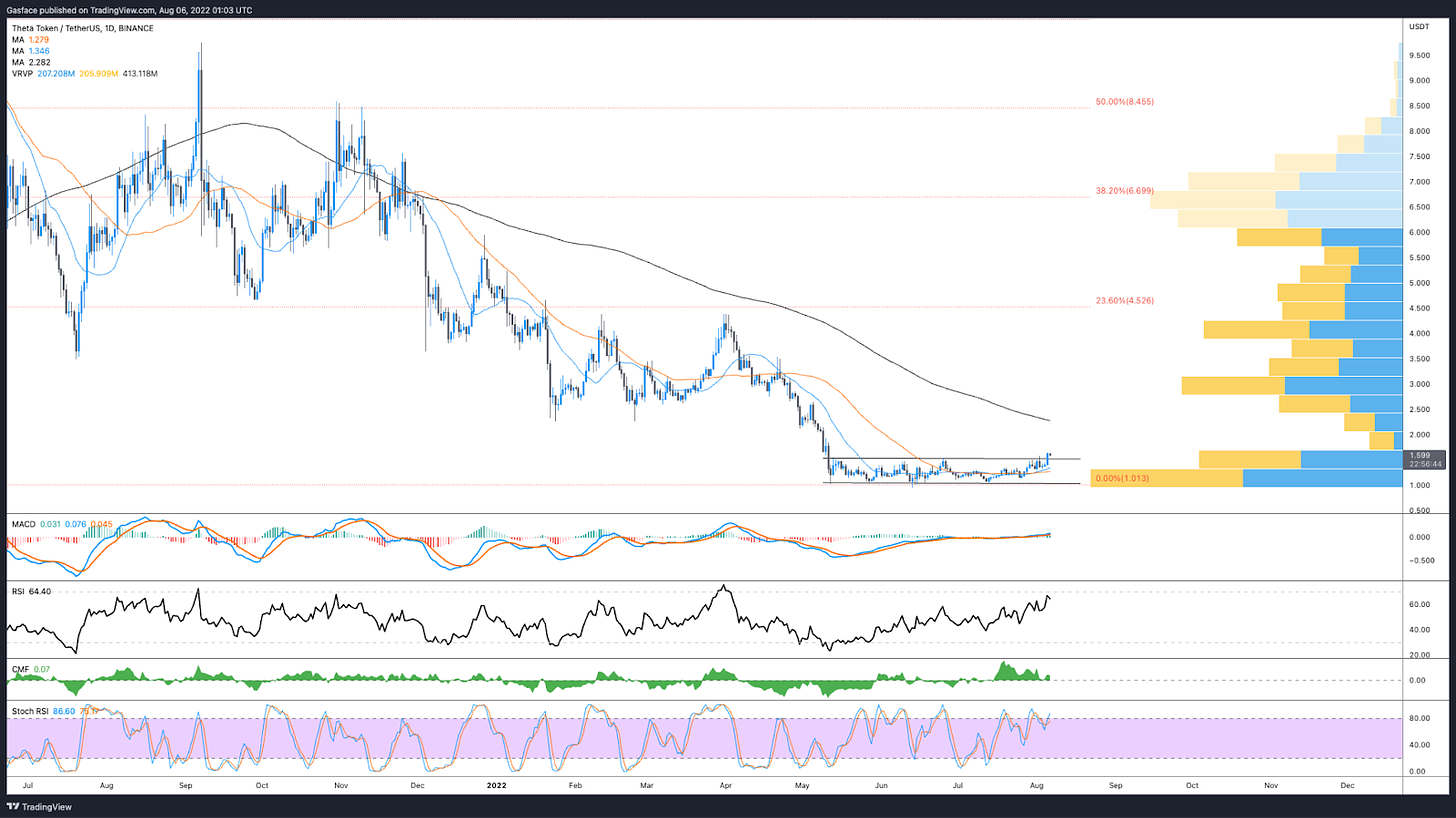
THETA daily chart
Theta reflects the same consolidation and bottoming pattern. The 20-MA recently crossed above the 50-MA and there’s a VPVR gap leading into the 200-MA. The price also recently peeked above the current range resistance, suggesting that continuation could be on the cards.
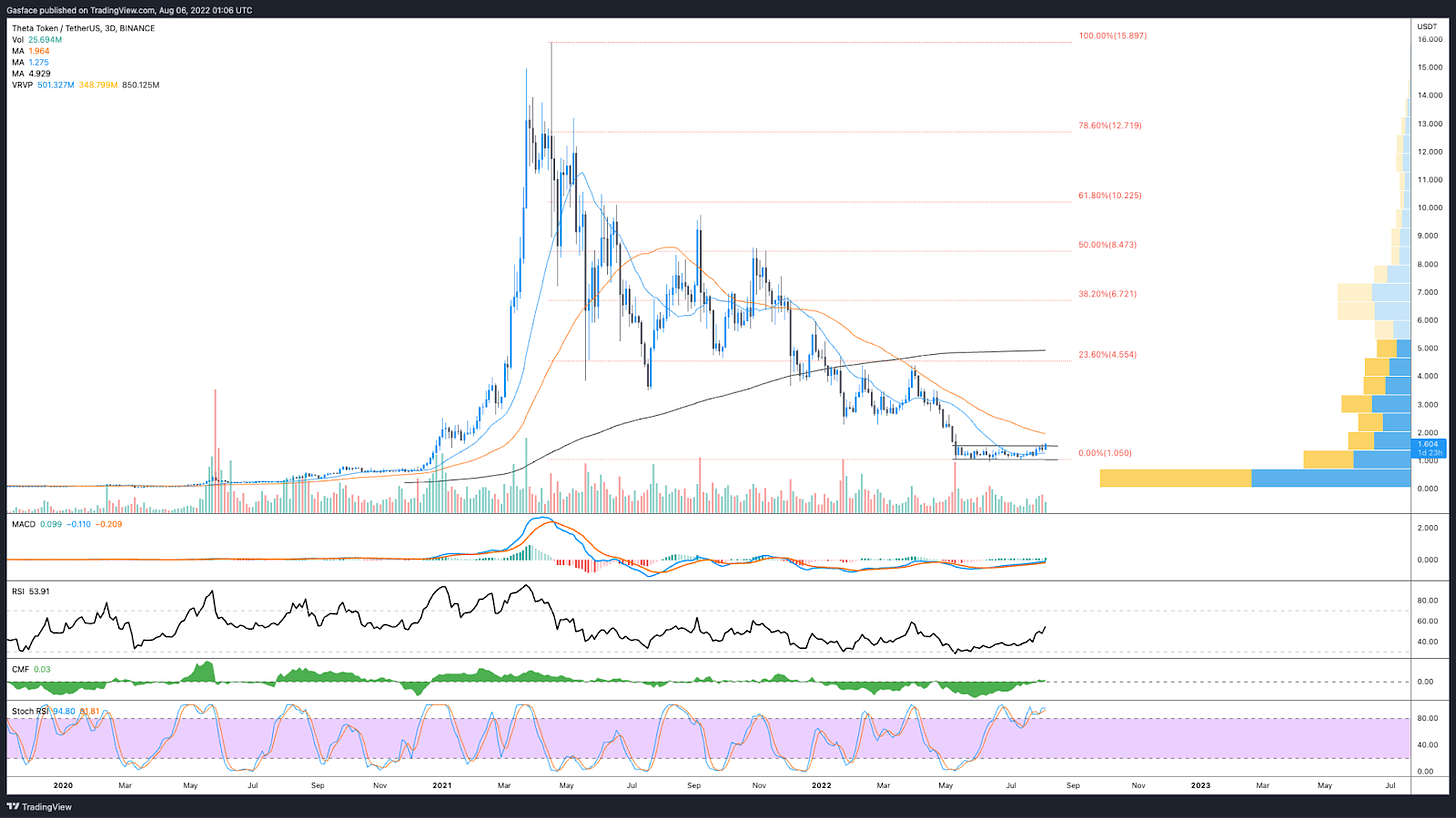
THETA 3-day chart
Zooming out on the higher time frame also shows THETA trading at a multi-year low.
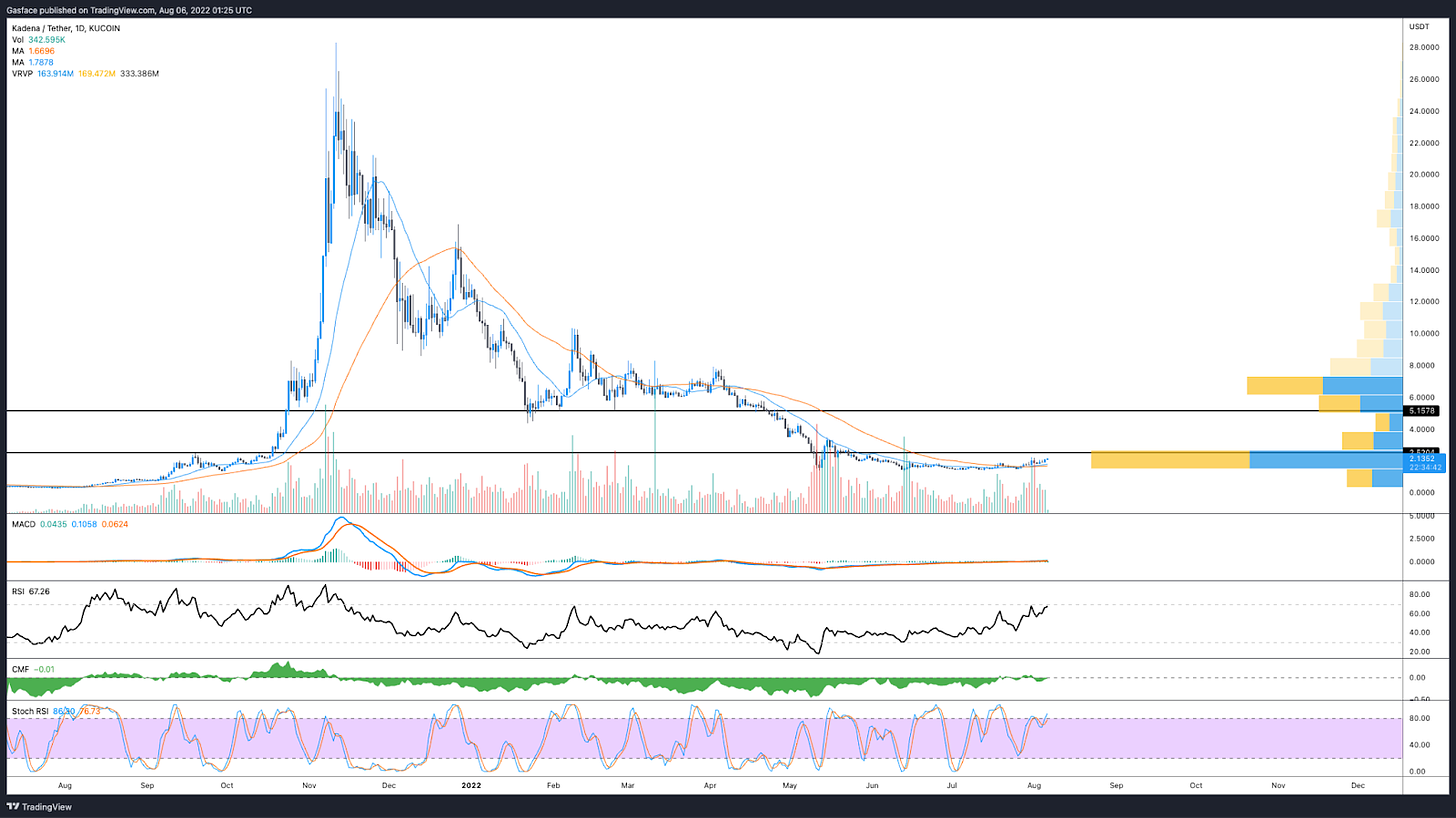
KDA daily chart
Is that another rounding bottom on Kadena (KDA)? The chart reflects nice daily volume and Kaden supposedly has a lucrative mining ecosystem and a $100 million development fund that is currently in play.
So, to wrap up. The early bird gets the worm, fortune favors the brave, and dollar cost averaging into multi-year bottoms is a proven strategy that brings substantial profits for crypto investors.
Is it time to go ape and YOLO into BTC, ETH and altcoins? No, not unless you’ve got deep pockets and spare powder to spare. What we can see is a market that has yet to bottom, plenty of downside threats on the horizon and a consensus that a lengthy market-wide consolidation phase is set to follow the elusive “bottom.” For the short term, and especially for momentum (swing) traders, the charts above suggest that, as long as Bitcoin continues to range, altcoins will be in accumulation mode and many will eventually fill in those wide VPVR gaps.
The Ethereum Merge (in September) is also proving to be a bullish event that continues to lift ETH price higher. Data shows that as ETH price rises, select altcoins also rise, even if Bitcoin price trends in a different direction.
There’s always the risk of further downside. We are in a strong bear market and high frequency, leverage and overtrading are great ways to destroy a portfolio. I’m of the mind that it's better to wait for clear confirmation that a HTF trend reversal is in play, hence my focus on dollar cost averaging and accumulation of proven performers.
Doing the necessary research to identify fundamentals beyond technical analysis is the duty of every investor and traders are encouraged to not spread themselves too thin by opening a position in every single bullish chart. Watch for those that hold above the 20-MA and show the highest daily trading volume, then let the trend be your friend.
Follow my grilling adventures and trades @big_smokey1 on Twitter and see my pnl from the $500 starter account.
The views expressed here are not intended to serve as trading advice. The author is not paid to analyze any of the assets mentioned above and know that they may or may not hold positions in the mentioned assets. Please be safe and DYOR.


