Bitcoin hitting $30K is a sign that the grill is hot
BTC’s recent price action could be the final sign that spring has sprung. Let’s cook!
In the most recent analysis I discussed the importance of being patient and allowing the meat to thaw out on its own. Now with Bitcoin price gravitating near $30,000 and Ethereum’s Shanghai upgrade scheduled for April 12, we’re finally able to see that a good bit of thawing has taken place.
Even with BTC price up more than 80% for the year and trading near the $30,000 level, many traders are not just assuming that it’s “up only” from here.
It’s likely that we’ll see some profit taking in the $30,000 to $36,000 zone. Of course some unforeseeable FUD will catalyze an eventual lower support retest in the $25,000 zone and there’s always the possibility of an unexpected black swan event that completely wipes the entire market out and alters the current market structure.
In a way, that’s all irrelevant if one’s risk management is proper, or if one is dollar cost averaging and being extra careful with the use of leverage.
What I want to focus on today are more higher timeframe data points that confirm that we are nearly done thawing and rounding the corner into what I hope will become more consolidation and upward momentum than the risk of sharp downside.
Given that this is a time sensitive update and that Shanghai is right around the corner, I’ll try to keep this one short and just focus on the charts.
Accumulatooors keep on accumulating!
Yes, last year was rough and a lot of big time and institutional traders lost their Bitcoin. Despite this, a positive sign is Bitcoin accumulation has simply continued and increased in pace throughout the worst parts of market sell-offs. I mean, look at what accumulatooors did when BTC price dropped to $15,000 and $19,000.
Smart money investors earn their moniker by doing the obvious…smart things. They accumulate during downtrends and consolidation phases, and then they distribute into new highs and moments of euphoria .
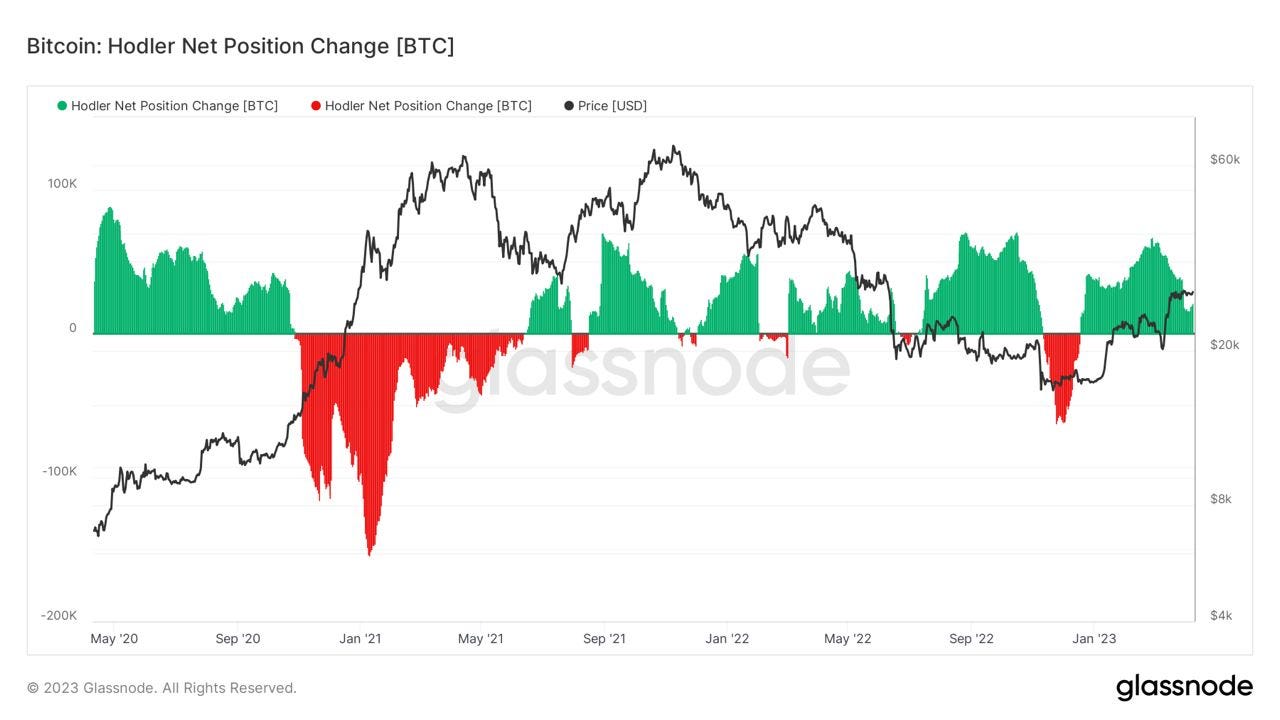
Looking at the 3-year chart of Bitcoin Hodler Net Position Change, we can see that since the start of 2023, hodlers have been accumulating. According to Glassnode:
“Hodler Net Position Change shows the monthly position change of long term investors (HODLers). It indicates when HODLers cash out (negative) and when net new positions are accumulated by HODLers.”
Of course short-term traders have distributed on highs and purchased lows because they are actively trading momentum, but what’s encouraging about the chart below is we have a clear multi-year view of how traders distribute into new highs. What’s interesting is that even with BTC price up 80%+ in 2023, hodlers continue to hold and accumulate.
Why?
Possibly because of a belief that BTC price has a ways to go, especially considering that price is still significantly down from its all time high.
Another reason could be that the next Bitcoin block reward halving is about 12 months away and in previous halving cycles magical price action has occurred.
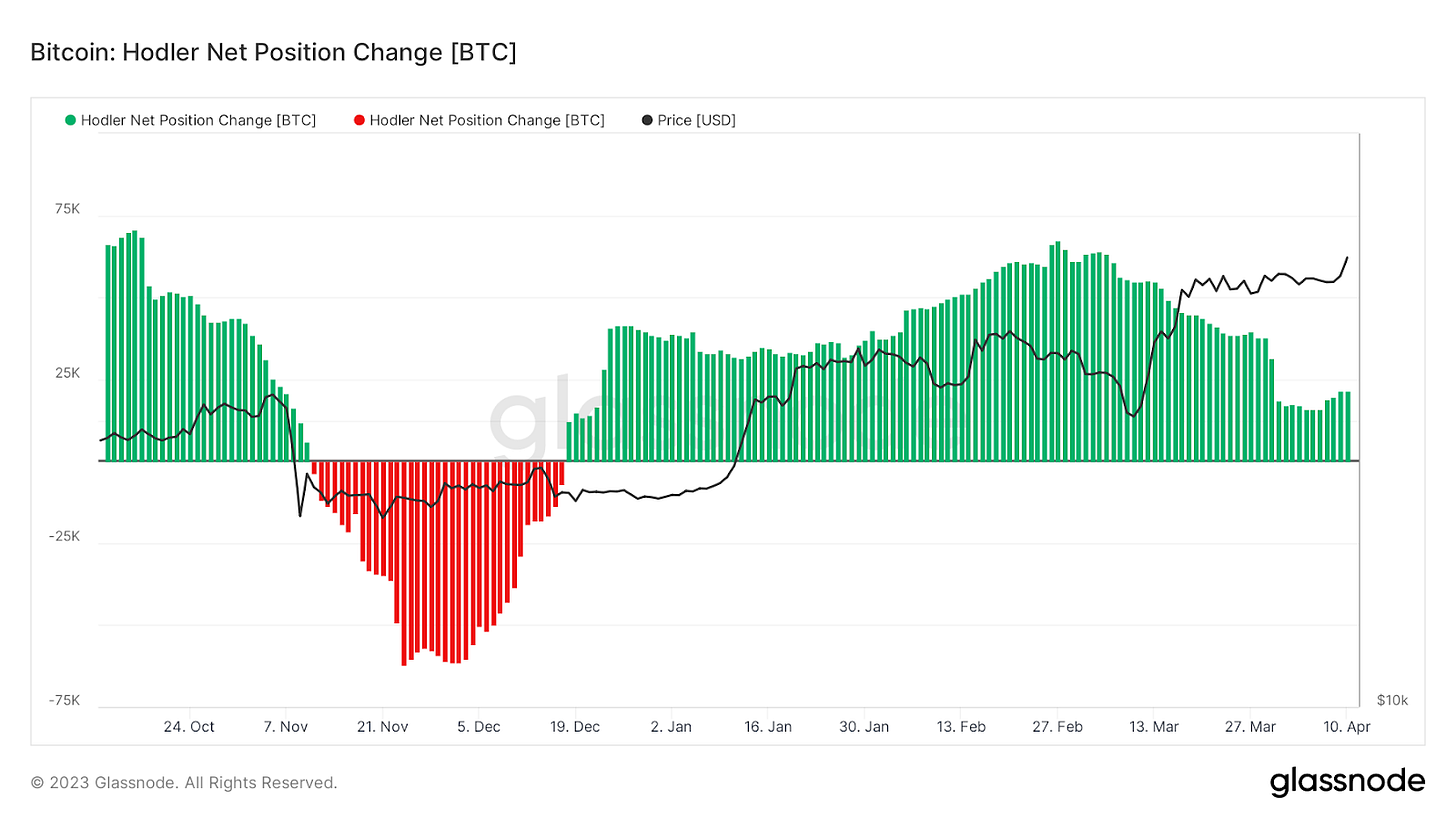
If you’re still feeling skeptical, here’s a 6 month view of the Bitcoin Hodler Net Position Change metric.
Still need more proof?
Glassnode’s Accumulation Trend Score metric also confirms that a bit of thawing has taken place and that traders with deep conviction have viewed the sharpest sell-offs as buying opportunities.
Glassnode says the indicator:
“...reflects the relative size of entities that are actively accumulating coins on-chain in terms of their BTC holdings. The scale of the Accumulation Trend Score represents both the size of the entity's balance (their participation score), and the amount of new coins they have acquired/sold over the last month (their balance change score). An Accumulation Trend Score of closer to 1 indicates that on aggregate, larger entities (or a big part of the network) are accumulating, and a value closer to 0 indicates they are distributing or not accumulating. This provides insight into the balance size of market participants, and their accumulation behavior over the last month.”
As shown in the chart, on April 11 the accumulation trend score was at 0.97 when price traded at $28,167. Scrolling back to Nov. 2022 when price traded in the $15,600 to $17,000 zone, the trend score was in the 0.92 to 0.99 zone, a sign of strong accumulation.
Roll back further to June 2022 when BTC price fell to $20,000, the market saw similar trend scores in the high 90s as traders with capital and cojones choose to scale into Bitcoin.
Now let’s take a look at a crowd favorite that I’ve focused on in the past. The Bitcoin MVRV Z-Score. The MVRV reflects a ratio of BTC’s market cap against its realized cap (the amount people paid for BTC compared to its current value).
It’s an easy indicator to read and keep track of.
When BTC’s market value is measurably higher than its realized value, the MVRV enters the red zone and this points to a potential market top. When the metric enters the green zone, it’s a signal that BTC’s current value is below the realized price, and is a sign that the market could be nearing a bottom.
As we can see below, the MVRV Z-score popped above the green area around Jan. 16 and price has been in an uptrend since then.
Now zoom out and view the MVRV Z-Score on a multi-year time frame and you’ll notice that a Z-Score reversal tends to mark the market bottom and the potential start of a new cycle.
So, on-chain data shows that the fearless traders have been accumulating for more than a year now. They added during the darkest days and the deepest sell-offs.
Sure, the greedy, over-leveraged, amateurs, degen BTC miners and scammers had a portion of their stack liquidated, hence the abrupt sharpness of the biggest sell-offs. But the sellers of last resort have been gone for a while, giving some clarity to BTC’s price resilience in the $19,000 to $22,000 zone.
I believe that on-chain data provides better signal than pure technical analysis, but when combining the two, a pretty confidence instilling view of the wider crypto market and Bitcoin’s price trajectory emerge.
Let’s have a quick look.
Bitcoin’s weekly market structure
The inverse head and shoulders pattern on Bitcoin’s weekly chart completed and with the neckline being met at $25,000, the short-term target now shifts to $33,500.
Market structure-wise, Bitcoin has painted 5 consecutive weekly higher high candles and previous analysis stressed the importance of a weekly close above $32,500. Perhaps the upcoming weeks will deliver on this.
Previous analysis also explained why the Hull Moving Average indicator provides powerful signal on market bottoms when viewed on the weekly timeframe. Since we last viewed the indicator, it has done nothing more than maintain its lime green color and the ribbon has thickened or widened which is a positive sign. As shown in the chart, shorter-term moving averages have also started to converge and BTC price trades well above them.
Generally, the weekly market structure looks great. Sure a retest of $25,000 and even $23,000 could occur, but lower support retests, profit taking and the occasional liquidation cascade are natural for high volatility assets like Bitcoin and Ethereum.
Speaking of which, on April 12 (Wednesday) the U.S. Consumer Price Index report comes out and the Federal Reserve is expected to issue guidance on the size of the next rate hike. We also have the PPI inflation report this week, Q1 bank earnings, jobless claims, retail sales and a consumer sentiment report.
CPI and PPI, plus Fed commentary tend to impact markets and with Ethereum’s Shanghai upgrade also occurring on April 12, it's possible that traders could shave off some risk. A CPI print and interest rate hike that goes against the market’s consensus could have a short-term negative impact on price.
Personally, I’m not bothered. The bulk of my bullish conviction is situated in Bitcoin’s compellingly bullish on-chain data plus its drastic change in market structure.
WTF is an NFT?
Alternative Assets demystifies and explains the hottest unique investment ideas out there. Collectibles, NFTs, Wine, Websites, even LEGOs. They don't just track the markets, they smash the markets.
Subscribe to Alternative Assets today.
Powered by Swapstack
Shanghai is coming!
I’ve spent the last 6 months exploring Ethereum’s on-chain activity and price with an eye to what might happen leading into the Shanghai upgrade which allows ETH stakers to unlock their coins.
Everyone is talking about the upgrade being a buy the rumor, sell the news event, and various analysts have mapped out quite detailed models of what ETH sell flow might look like and how this might pressure ETH price.
While I don’t have a hard estimate mapped out for what I think will happen, we can review the data and consider how certain outcomes might present opportunities for momentum traders and holders alike.
There are those that have been harping about how Shanghai unlocks will immediately catalyze mass spot selling and a dump in ETH price. If that were truly the case, then why is the total number of staked ETH continuing to rise? The figure currently sits at 18.14 million ETH staked, which is equivalent to $34.6 billion dollars!
Like we’ve done in previous analysis, let’s take a look at exactly which cohorts of ETH hodlers are accumulating and which have taken a pause or decided to sell.
As we can see in the ETH addresses with a balance greater than 1,000, 10,000 and 32 chart below, the last 6 months has been a bit of a mixed bag. The uptick in all balance cohorts started to decline in December 2022 before seeing a mild increase in March.
Addresses holding 32 ETH have flatlined going into the upgrade, while addresses with 1,000 and 10,000 ETH increased in the past 2 weeks.
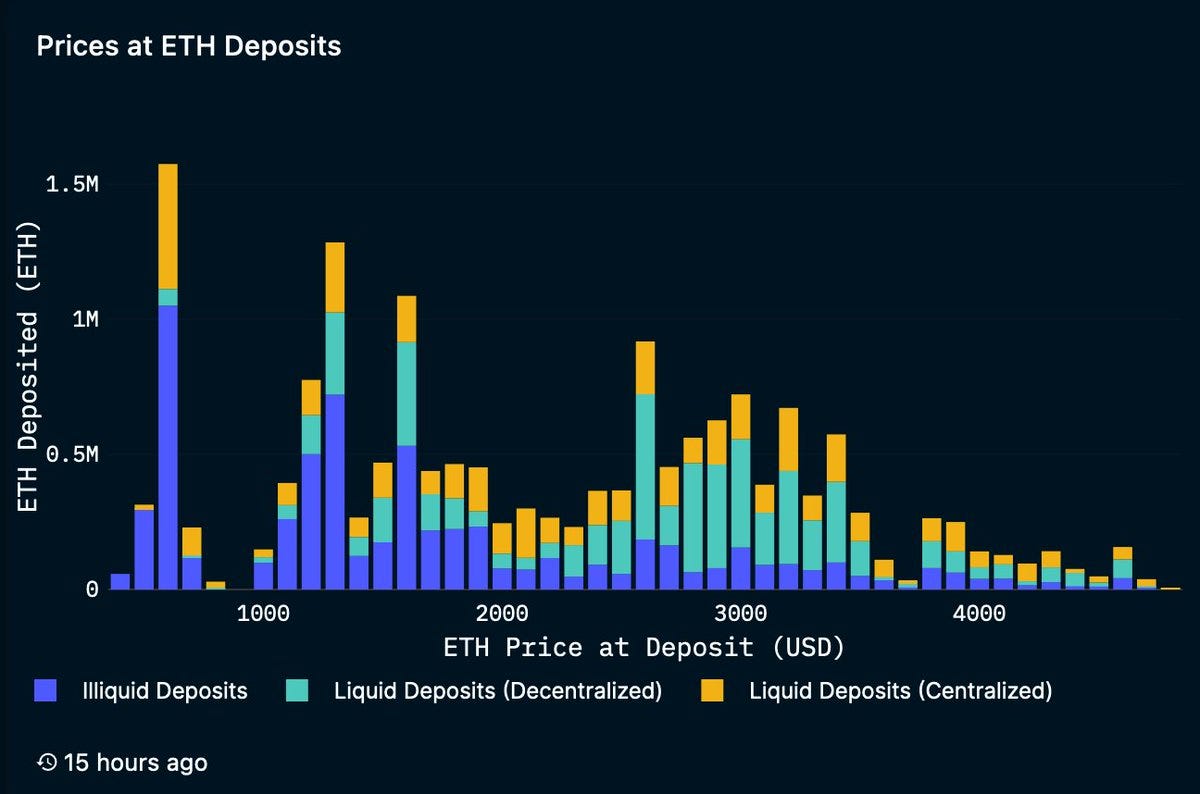
On-chain data from Nansen provides a bit more color to the recent movement.
According to the on-chain analytics provider, the first spike in ETH deposits was around $600, and deposits followed a “relatively consistent” clip all the way up to $3,400 “before tapering off.”
If all this talk about BBQ, smoking meat and brisket is making you hungry then why not go ahead and do a little meat shopping?
Receive $25 off your order with code SWAPSRF at Snake River Farms!
Shop Delicious Meats Now
Powered by Swapstack
They go on to explain that “24.5% of all staked ETH belongs to illiquid stakers that are in profit, totaling approximately 4.1M ETH ($6.9B)” and according Nansen, this is the cohort that is most likely to withdraw and possibly sell into profit, or perhaps restake elsewhere within DeFi where liquid staking derivative providers offer higher staking yields.
Because liquid staking derivatives have been a magnet for locked ETH, and a potential deterrent for un-staking from the ETH Beacon Chain, it's important to also consider what type of inflow or outflow is taking place within these protocols and their tokens. Instead of going through the garble of it all, I think this thread from Nansen Research does a great job of updating on the current status of LSD tokens and who might be buying or selling them.
Glassnode also just published a fantastic, granular breakdown of ETH staking cohorts, their behavior and various potential outcomes that could occur after the Shanghai upgrade. I highly suggest having a read.
Risk management is still the ultimate key to survival
In my view, taking a conservative, risk off stance going into such a major upgrade is the most prudent option. 32 ETH and under cohorts have flatlined in their ETH accumulation and staking, likely hedging and waiting to see what happens during and after the upgrade.
The key is to be positioned for breakdowns and breakouts, while also keeping an eye on the on-chain data to see if ETH cohort accumulation resumes after the upgrade.
I’ll be curious to see if unlocked ETH flows into LSD platforms that offer higher yields. From a traders’ perspective, being nimble and ready to play ball is what I’m looking for.
If Ethereum price sell-offs to the $1,400 to $1,300 level, I’ll view it as a discount.
If ETH price rallies above $2,000 and secures a few daily closes at this level, then a momentum play up to $2,800 could be in development.
The key here is to remember that upgrades induce volatility and this market, while looking quite bullish, might not be fully thawed yet. Patience, discipline and planning remain key in the long-term.
Happy trades my friends!
Follow my grilling adventures and trades @big_smokey1 on Twitter.
Thanks for reading The Humble Pontificator! Subscribe for free to receive new posts and support my work.
If you feel like donating here is how and where:
Bitcoin Lightning Network:

Bitcoin Segwit:
Ethereum / USDC / USDT:
The views expressed here are not intended to serve as trading advice. The author is not paid to analyze any of the assets mentioned above and know that I may or may not hold positions in the mentioned assets. Please be safe and DYOR.


